Figures & data
Table 1 Soil Series (with number of sites in parentheses), New Zealand Soil Classification (NZSC), S-map (family/sibling code), parent material and origin, soil drainage class, and site category (with number of sites in parentheses) (Hewitt Citation1998; Lilburne et al. Citation2011, Taylor Citation1954).
Figure 1 Changes in mean Olsen P concentrations, bulk density and macroporosity (−5 kPa), for three soil sampling periods. The boxes represent the inter-quartile range (25th to 75th percentile) and the whiskers show the range of values that fall within the inner fences. •=outliers. The median is shown as a line in each box.
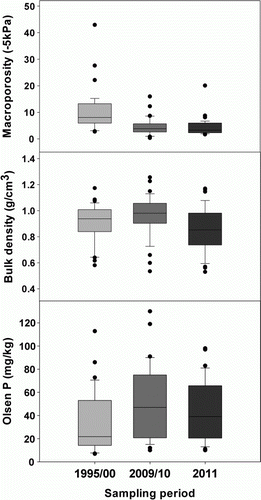
Table 2 Concentrations of Olsen P (mg/kg), total carbon (%), total nitrogen (%), bulk density (g/cm3) and macroporosity −5 and −10 kPa (% v/v) for control and tread treatments. Standard error of difference (SED) is given for comparison between treatments. ns and *** denote not significant and significant at the P<0.001 level, respectively.
Figure 2 Concentrations of Olsen P (mg/kg), total carbon (%) and macroporosity −10 kPa (% v/v) for the interaction of control and tread treatments with Soil Order. The least significant difference (LSD05) is given for the interaction of control and tread treatments and Soil Orders.
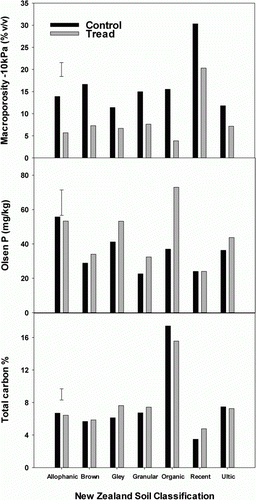
Table 3 Concentrations of Olsen P (mg/kg), total carbon (%) and total nitrogen (%), bulk density (g/cm3), macroporosity −5 and −10 kPa (% v/v) for Soil Order. Standard error of difference (SED) is given for comparison between Soil Orders for combined control and tread treatments. *** denotes significant at the P<0.001 level.
Figure 3 Correlations between bulk density (g/cm3) and (A) total carbon (%) and (B) total nitrogen (%). There was no significant difference between regression lines for control and tread treatments for the correlation between bulk density and total carbon, therefore only a single line was fitted (A). There was a significant difference between regression lines for control and tread treatments for the correlation between bulk density and TN and therefore two lines were fitted (B).
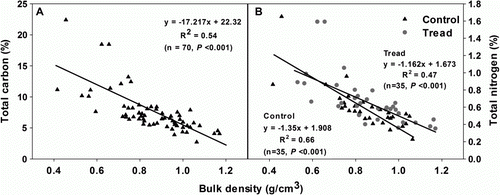
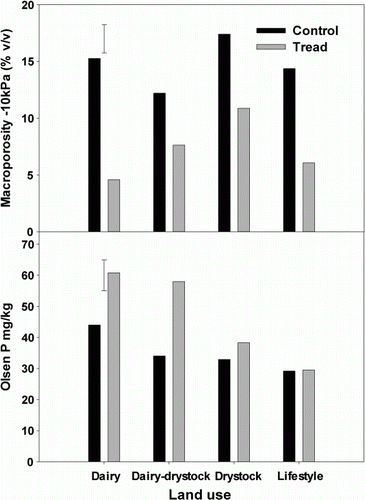
Figure 4 Concentrations of Olsen P (mg/kg) and macroporosity −10 kPa (% v/v) for control and tread treatments for land use types. The least significant difference (LSD05) is given for the interaction of control and tread treatments and land use types.