Figures & data
Table 1 Selected properties and trace element concentrations of the soil used in the experiments.
Table 2 Composition (in mg L−1 WH and mg kg−1 of wool) and pH of wool hydrolysate used in the experiments (n=3).
Figure 1 Relationships between added amount of WH per kg soil and NaNO3 extractable soil Zn (A, ○) and Fe (B, ○). • corresponds to the amount of TE added to the soil with the WH solution per kg of soil.×represents the TE concentration that would be expected to result from TE-free WH addition. Error bars represent±standard deviation of triplicates (n=3).
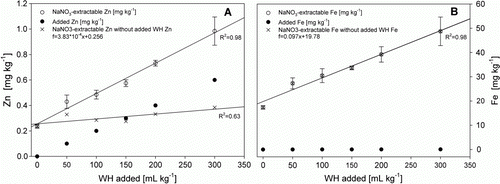
Figure 2 Mean grain versus shoot dry weight per plant of the controls (C), a treatment with the same elemental composition (MF) as in the WH and the WH treatment. Different letters indicate statistically significant difference (P<0.05). Error bars represent±standard deviation of four replicates (n=4).
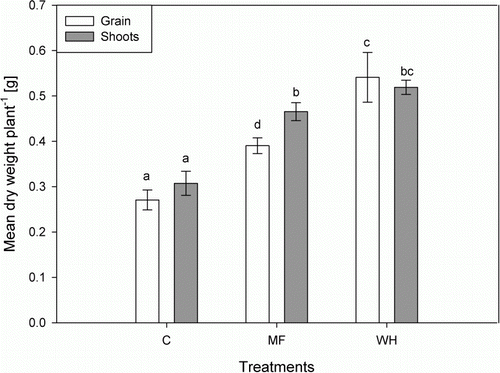
Figure 3 Mean Zn and Fe concentrations in grains (A) and shoots (B) of the controls (C), a treatment with the same elemental composition (MF) as in the WH and the WH treatment. Different letters indicate statistically significant difference (P<0.05). Error bars represent±standard deviation of four replicates (n=4).
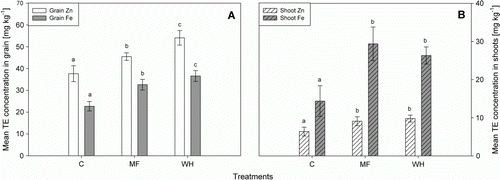
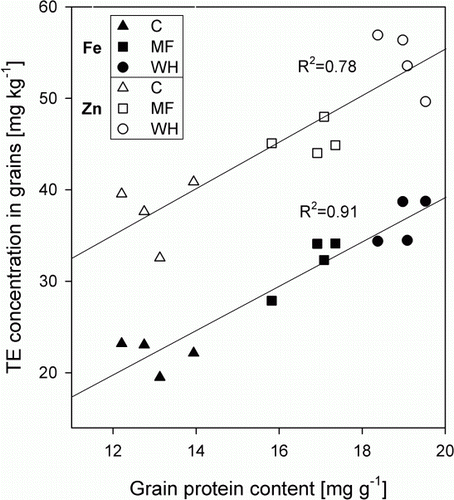
Figure 4 Relationship between Zn (○) and Fe (•) concentrations and protein content in the grains, determined using a N:protein conversion factor (Mosse Citation1990).