1,543
Views
33
CrossRef citations to date
0
Altmetric
Special section: Regional responses to dicyandiamide (DCD) in New Zealand

Dicyandiamide (DCD) effect on nitrous oxide emissions, nitrate leaching and pasture yield in Canterbury, New Zealand

, &
Pages 251-270 | Received 07 Nov 2012, Accepted 26 Mar 2013, Published online: 23 Sep 2014

Figures & data

Table 1 Top soil (0–75 mm) properties for the research areas on the Lincoln University Research Dairy Farm Canterbury, New Zealand (43o38′11″ S, 172o26′18″E) (Blakemore et al. Citation1987).

Figure 1 Daily average soil temperature at 10 cm depth. A, 2009–10; B, 2010–11; C, 2011–12.
Figure 2 Daily water inputs (rainfall+irrigation) (bar) and cumulative water inputs (line). A, 2009–10; B, 2010–11; C, 2011–12.
Figure 3 Daily N2O emissions from animal urine or dung and with or without DCD. A, 2009–10; B, 2010–11; C, 2011–12. The vertical bars represent the standard error of the mean.

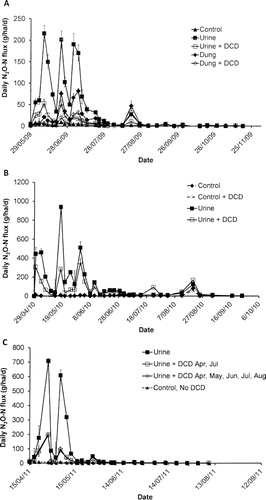
Table 2 Total N2O emissions, emission factor values and reduction of the emission factor by DCD.

Figure 4 Nitrate-N concentration in the 0–10 cm soil. A, 2009–10; B, 2010–11; C, 2011–12. The vertical bars represent the standard error of the mean.
Figure 5 DCD concentrations in the 0–10 cm soil. A, 2009–10; B, 2010–11; C, 2011–12. The vertical bars represent the standard error of the mean.
Figure 6 Total nitrate-N leaching losses from urine with or without DCD. A, 2010–11; B, 2011–12. The vertical bars represent the standard error of the mean.

Table 3 Spring and annual dry matter yields and yield responses in the mowing trials.

Table 4 Spring and annual dry matter yields and yield responses in the grazing trials.

Table 5 Summary of published New Zealand trial data on effectiveness of DCD nitrification inhibitor in reducing nitrate leaching losses from animal urine patches.

Reprints and Corporate Permissions

Please note: Selecting permissions does not provide access to the full text of the article, please see our help page How do I view content?

To request a reprint or corporate permissions for this article, please click on the relevant link below:

Academic Permissions

Please note: Selecting permissions does not provide access to the full text of the article, please see our help page How do I view content?

Obtain permissions instantly via Rightslink by clicking on the button below:

If you are unable to obtain permissions via Rightslink, please complete and submit this Permissions form. For more information, please visit our Permissions help page.