Figures & data
Figure 1 Manawatu Catchment above Teachers' College and the Upper Manawatu Catchment above Hopelands. Scale is 0–24 km. Major sampling sites are Palmerston North Teachers' College; Hopelands; Ta, Tamaki; T, Tiraumea; K, Mangatainoka; H, Mangahao; P, Pohangina; ○, waste water treatment plants.
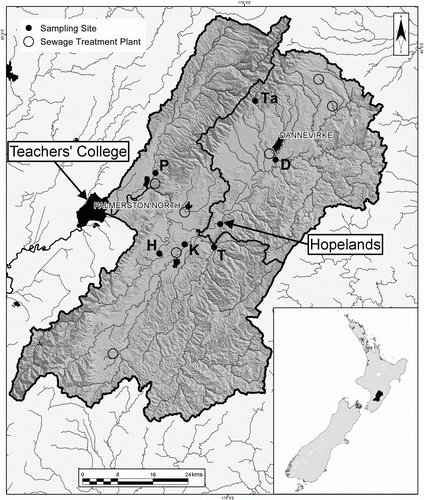
Table 1 Land use (ha) from Horizons databases.
Table 2 DRP and DOP concentrations of 21 samples collected at various flows at Teachers' College between 2004 and 2005.
Table 3 Long-term average annual mass of sediment and PP load at Hopelands and Teachers' College modelled by NZeem®.
Table 4 P contents of samples of sediment collected during six flood events at Teachers' College.
Table 5 Length, width, area of wetted area of the river, and mean concentration of fine sediment on the river bed, and total amount of fine sediment on the river bed to a depth of 10 cm. Mean samples taken on 30 March and 22 April 2010.
Table 6 Mean total P concentration, kg P,% inorganic P and organic P in fine sediment in the river bed to a depth of 10 cm. Samples taken on 30 March and 22 April 2010.
Table 7 Bicarbonate-P and P extracted by 0.1M NaOH from the fine sediments in the river bed.
Table 8 Mean dissolved P, measured and estimated, from township waste water treatment plants (WWTP) and industries measured in 2010–12.
Figure 2 Sources of dissolved P in Manawatu River at Hopelands (black) and Teachers' College (grey).
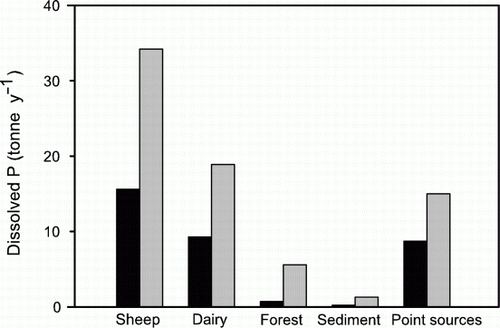
Table 9 Estimate sources of various forms of P at Hopelands per year from 1989–2009.
Table 10 Sources of various forms of P at Teachers' College per year from 1989 to 2009.
Figure 3 Modelled estimates of sources of dissolved P (DRP + DOP) in the Manawatu River at Hopelands in 2010 (black), and loads achievable by 2020 (grey) if recommendations were implemented (t P yr−1). Note: Some of the 511 t of PP remains on the bed of the river and generates a maximum of 0.3 t of dissolved P yr−1.
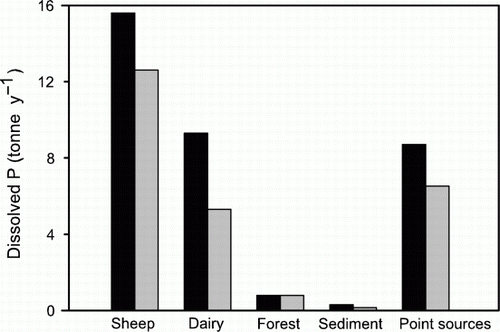
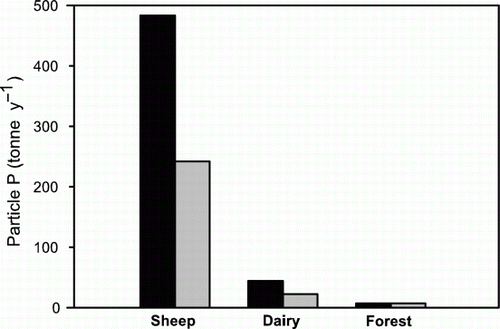
Figure 4 Modelled estimates of sources of particulate P in Manawatu River at Hopelands in 2010 (black), and loads achievable by 2020 (grey) if recommendations were implemented on all affected land on day 1 (t P yr−1).