546
Views
3
CrossRef citations to date
0
Altmetric
Research articles

Competitive exclusion of Cirsium arvense in pasture: a simulated neighbour grazing-height experiment

, , &
Pages 1-12 | Received 09 Dec 2013, Accepted 12 May 2014, Published online: 12 Nov 2014

Figures & data

Figure 1 Key steps in Experiments 1 and 2.
Figure 2 Growth responses (log10[g dry mass/m2] averaged over four replicates) of the creeping roots (A, C) and subterranean shoots (B, D) of Cirsium arvense to the presence of neighbouring pasture species Lolium perenne and Trifolium repens maintained at different heights in Experiments 1 and 2: No pasture (
); Short pasture (
); Long pasture (
); Hay (
). The two vertical bars are the two LSD (5%) values for the trimming treatment by harvest time interaction table as output by an analysis of variance for a split-plot design. The right-hand bar is for any comparison between times of harvest means for a particular trimming treatment. The left-hand bar is for any other comparison of means, including the comparison of trimming treatment means for a particular time of harvest. The x-axis labels align with the first day of the month.
Figure 2 Growth responses (log10[g dry mass/m2] averaged over four replicates) of the creeping roots (A, C) and subterranean shoots (B, D) of Cirsium arvense to the presence of neighbouring pasture species Lolium perenne and Trifolium repens maintained at different heights in Experiments 1 and 2: No pasture (Display full size); Short pasture (Display full size); Long pasture (Display full size); Hay (Display full size). The two vertical bars are the two LSD (5%) values for the trimming treatment by harvest time interaction table as output by an analysis of variance for a split-plot design. The right-hand bar is for any comparison between times of harvest means for a particular trimming treatment. The left-hand bar is for any other comparison of means, including the comparison of trimming treatment means for a particular time of harvest. The x-axis labels align with the first day of the month.
Figure 3 Growth responses (log10[g dry mass/m2] averaged over four replicates) of the aerial shoots of Cirsium arvense (A, D) and the neighbouring pasture species Lolium perenne and Trifolium repens (B, E) where the latter were maintained at different heights, and the percentage contribution that C. arvense made to the total sward (C, F) in Experiments 1 and 2: No pasture (
); Short pasture (
); Long pasture (
); Hay (
). In D and F, values for the ‘Hay’ treatment were mostly zeroes and are excluded from the analyses. The two vertical bars are the two LSD (5%) values for the trimming treatment by harvest time interaction table as output by an analysis of variance for a split-plot design. The right-hand bar is for any comparison between times of harvest means for a particular trimming treatment. The left-hand bar is for any other comparison of means, including the comparison of trimming treatment means for a particular time of harvest. In C and F, the error bars exclude the ‘No pasture’ treatment where the sward was always 100% C. arvense. The x-axis labels align with the first day of the month.
Figure 3 Growth responses (log10[g dry mass/m2] averaged over four replicates) of the aerial shoots of Cirsium arvense (A, D) and the neighbouring pasture species Lolium perenne and Trifolium repens (B, E) where the latter were maintained at different heights, and the percentage contribution that C. arvense made to the total sward (C, F) in Experiments 1 and 2: No pasture (Display full size); Short pasture (Display full size); Long pasture (Display full size); Hay (Display full size). In D and F, values for the ‘Hay’ treatment were mostly zeroes and are excluded from the analyses. The two vertical bars are the two LSD (5%) values for the trimming treatment by harvest time interaction table as output by an analysis of variance for a split-plot design. The right-hand bar is for any comparison between times of harvest means for a particular trimming treatment. The left-hand bar is for any other comparison of means, including the comparison of trimming treatment means for a particular time of harvest. In C and F, the error bars exclude the ‘No pasture’ treatment where the sward was always 100% C. arvense. The x-axis labels align with the first day of the month.
Figure 4 The effects of the trimming treatments in Experiments 1 (A) and 2 (B) as viewed in mid January 2007 and 2008, respectively. From left to right: No pasture; Short pasture; Long pasture; Hay.
Figure 5 The flux in the aerial shoots of Cirsium arvense (averaged over four replicates) during the course of Experiment 2 as affected by the treatments: A, No pasture; B, Short pasture; C, Long pasture; D, Hay. Shown are the cumulative number of shoot births (+), cumulative shoot deaths (
) and net shoot population size (
) in units of shoots/m2. The x-axis labels align with the first day of the month.
Figure 5 The flux in the aerial shoots of Cirsium arvense (averaged over four replicates) during the course of Experiment 2 as affected by the treatments: A, No pasture; B, Short pasture; C, Long pasture; D, Hay. Shown are the cumulative number of shoot births (+), cumulative shoot deaths (Display full size) and net shoot population size (Display full size) in units of shoots/m2. The x-axis labels align with the first day of the month.

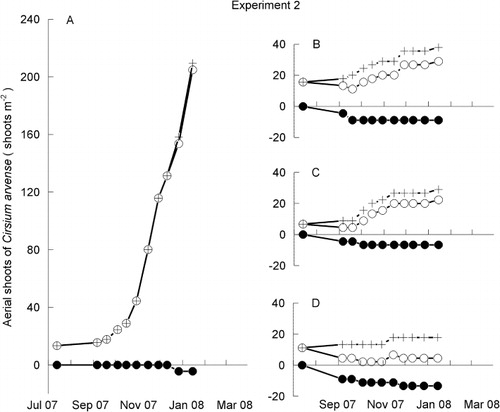
Table 1 Cumulative total numbers of aerial shoot births and deaths and net population size (shoots/m−2) at the end of Experiment 2 as illustrated in . For calculating the linear contrast, average pasture heights were taken to be 0, 40, 125 and 335 mm for the four treatments, respectively (in the order shown in the table).

Figure 6 The effect of the height of the neighbouring pasture species Lolium perenne and Trifolium repens on the final (autumnal) dry mass (g/m2) of the aerial shoots (dashed lines) and creeping roots (solid lines) of Cirsium arvense in Experiments 1 (
) and 2 (
). The plotted mean dry masses are the last values plotted in , (shoots) and 2A, 2C (roots), respectively. The horizontal axis values are mean pasture heights of 0, 40, 125 and 335 mm for No pasture, Short pasture, Long pasture and Hay, respectively.
Figure 6 The effect of the height of the neighbouring pasture species Lolium perenne and Trifolium repens on the final (autumnal) dry mass (g/m2) of the aerial shoots (dashed lines) and creeping roots (solid lines) of Cirsium arvense in Experiments 1 (Display full size) and 2 (Display full size). The plotted mean dry masses are the last values plotted in Fig. 3A, 3D (shoots) and 2A, 2C (roots), respectively. The horizontal axis values are mean pasture heights of 0, 40, 125 and 335 mm for No pasture, Short pasture, Long pasture and Hay, respectively.

Reprints and Corporate Permissions

Please note: Selecting permissions does not provide access to the full text of the article, please see our help page How do I view content?

To request a reprint or corporate permissions for this article, please click on the relevant link below:

Academic Permissions

Please note: Selecting permissions does not provide access to the full text of the article, please see our help page How do I view content?

Obtain permissions instantly via Rightslink by clicking on the button below:

If you are unable to obtain permissions via Rightslink, please complete and submit this Permissions form. For more information, please visit our Permissions help page.