Figures & data
Table 1 Basic soil properties (0–7.5 cm depth).
Table 2 Details of urine and fertiliser treatments applied to lysimeters.
![Figure 2 Daily and cumulative rainfall and cumulative drainage at experimental site over the duration of study. Note this does not include the 80 mm (8 × 10 mm) simulated rainfall applied after the split fertiliser applications.](/cms/asset/03a20b70-012f-430a-b83f-859875b2f666/tnza_a_1031405_f0002_b.jpg)
![Figure 3 Mean temporal N2O emissions, daily rainfall and soil moisture from A, nil urine; B, autumn urine; C, spring urine treatments. F0, F2 and F4 = fertiliser rates of 0, 200 and 400 kg N ha–1; and U0, UA and US = nil, autumn- and spring-urine applications, respectively. Bold arrows indicate urine + 15N fertiliser application, other arrows indicate split fertiliser applications. Error bars = LSR (5%), error is only shown if LSR is >5, n = 4. Note different y axis scales.](/cms/asset/cf097c24-92cb-4125-af66-fc9212a789a1/tnza_a_1031405_f0003_oc.jpg)
![Figure 4 Mean cumulative recovery of N2O-15N from 15N affected treatments. F0, F2 and F4 denote fertiliser rates of 0, 200 and 400 kg N ha–1; U0, UA and US denote nil, autumn- and spring-urine applications, respectively. Bold arrows indicate urine + 15N fertiliser application, other arrows indicate split 15N fertiliser applications. Error bar = LSD (5%), n = 4.](/cms/asset/934e64a2-4275-4059-984a-378bde597842/tnza_a_1031405_f0004_b.jpg)
![Figure 5 Mean fertiliser contribution to the N2O flux from 15N affected treatments, expressed as a percentage of the total N2O flux. F0, F2 and F4 denote fertiliser rates of 0, 200 and 400 kg N ha–1; U0, UA and US denote nil, autumn- and spring-urine applications, respectively. Bold arrows indicate urine + 15N fertiliser application, other arrows indicate split 15N fertiliser applications.](/cms/asset/3a89c382-ac72-44d7-ac7d-ef25c95ac24a/tnza_a_1031405_f0005_b.jpg)
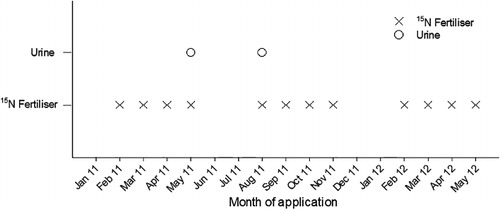
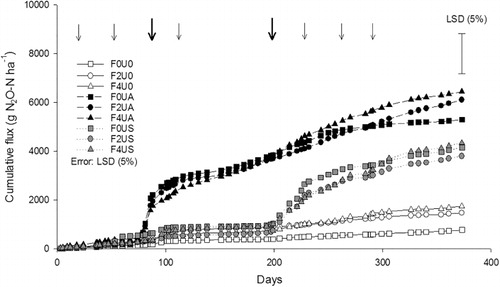
Table 3 Cumulative N2O-N fluxes as a percentage of total N applied and as an emission factor for total N applied.
![Figure 6 Mean cumulative N2O emissions from all treatments. F0, F2 and F4 = fertiliser rates of 0, 200 and 400 kg N ha–1; and U0, UA and US = nil, autumn- and spring-urine applications, respectively. Bold arrows indicate urine + N fertiliser application, other arrows indicate split fertiliser applications. Error = LSD (5%), n = 4.](/cms/asset/a7f542fa-355e-4a5e-805b-a11302b14348/tnza_a_1031405_f0006_b.jpg)