Figures & data
Figure 1. Components of the Land Use Capability classification (source: Lynn et al. Citation2009).
Figure 2. Increasing limitations to use and decreasing versatility of use from LUC Class 1 to LUC Class 8 (modified from SCRCC [Citation1974]). † includes vegetable cropping (source: Lynn et al. Citation2009).
![Figure 2. Increasing limitations to use and decreasing versatility of use from LUC Class 1 to LUC Class 8 (modified from SCRCC [Citation1974]). † includes vegetable cropping (source: Lynn et al. Citation2009).](/cms/asset/7732b487-bf71-494c-a3c4-c961bc1d1a53/tnza_a_1092996_f0002_b.gif)
Table 1. Reproduction of table 13.2 of the Decision Version of the One Plana with reducing Class limits over a 20-year period (Horizons Regional Council Citation2014).
Table 2. Estimates of NZLRI attainable stock-carrying capacities for LUC Classes mapped in the Canterbury Region under rain-fed agricultural conditions (from Hunter et al. [Citation1980] and Van Berkel [Citation1983]).
Table 3. Estimates of NZLRI attainable stock carrying capacities for LUC Class and LUC Subclasses mapped in the Canterbury Region under rain-fed agricultural conditions (derived from Prickett [Citation1978] and Van Berkel [Citation1983]).
Table 4. Variability in nitrate storage and reduction, and hence relative nitrate leaching, for a sequence of soils within LUC Class 3, on the eastern plains (adapted from Hewitt et al. [Citation2015]).
Figure 3. Potential carrying capacity values found in the Selwyn-Waihora Zone. Diamond (blue) and triangle (green) symbols are the rain-fed values; triangles (green) indicate the dryland values for irrigable LUC (land use capability) units and square symbols (red) show their corresponding irrigated carrying capacity. Diamond (blue) symbols indicate LUC units that are not irrigable.
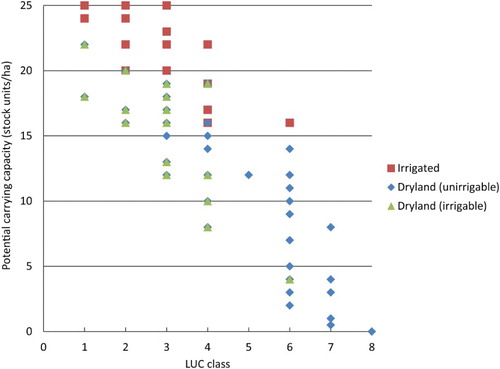
Table 5. Area in hectares of LUC Classes 1–8, estuaries, lakes, quarries, rivers and towns in the Canterbury Region and nationally as mapped during the NZLRI survey, 1975–1999.
Figure 4. Mean potential livestock carrying capacity under rain-fed and irrigated pasture agriculture for LUC Class 1–8 land.