Figures & data
Table 1. Mean soil water-extractable P (WEP) and Olsen P for each treatment.
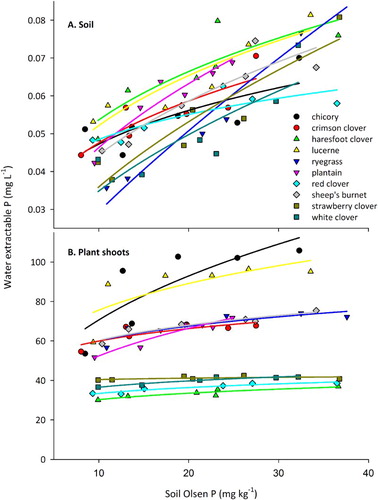
Figure 1. Mean concentration of water extractable P (WEP) in soil (A) sampled at the end of the trial, and in shoot material (B) bulked across all harvests of different plant species grown across a range of soil Olsen P concentrations. Lines represent the fit (P < 0.05) of a power function (y = axb) to each species.