Figures & data
Figure 1. Plot layout showing the concentric zones A, B and C and their dimensions and areas.
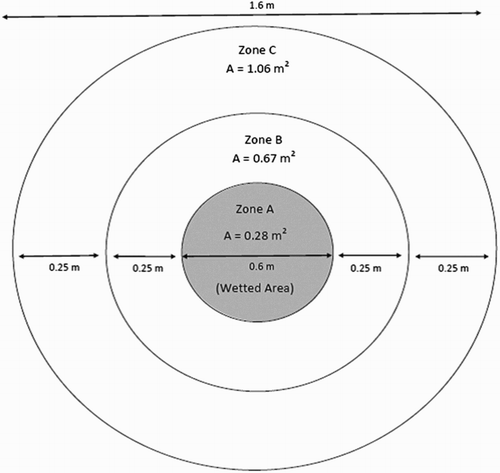
Figure 2. Mean pasture yields in zones A, B and C for treatments A, urine + fertiliser; B, urine only; C, fertiliser only; D, control. Error bars = LSD (95%), n = 4.
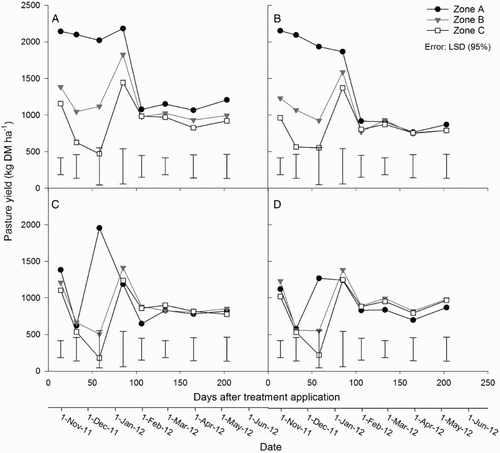
Figure 3. Cumulative pasture yields in zones A, B and C for each treatment. Different letters represent a statistically significant difference between yields within treatments. Error bar = LSD (95%), n = 4.
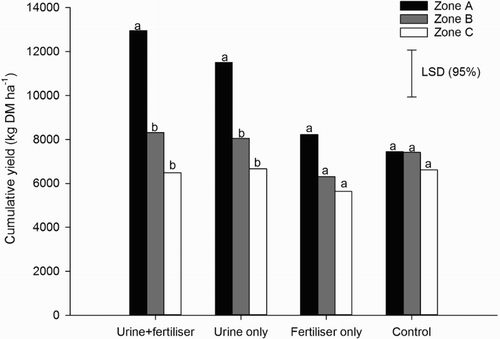
Figure 4. Mean pasture N content in zones A, B and C for the A, urine + fertiliser; B, urine only; C, fertiliser only; and D, control treatments. Error bars = LSD (95%), n = 4.
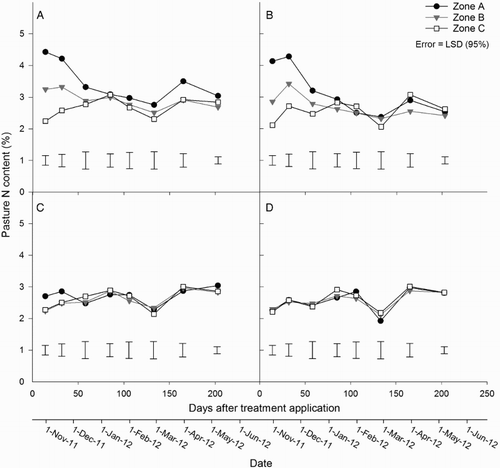
Figure 5. Mean pasture N uptake in zones A, B and C for the A, urine + fertiliser; B, urine only; C, fertiliser only; and D, control treatments. Error bars = LSD (95%), n = 4.
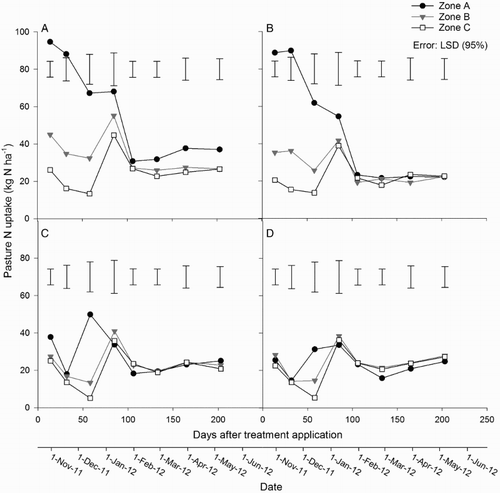
Figure 6. Mean cumulative N uptake in zones A, B and C for each treatment. Different letters represent a statistically significant difference within treatments. Error bar = LSD (95%), n = 4.
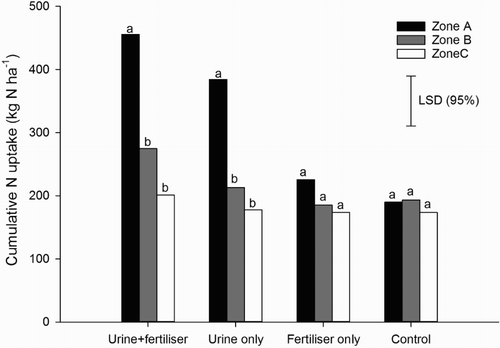
Figure 7. Pasture 15N recovery in zones A, B and C for the A, urine + fertiliser; B, urine only; C, fertiliser only; and D, control treatments. Error bars = LSD (95%), n = 4.
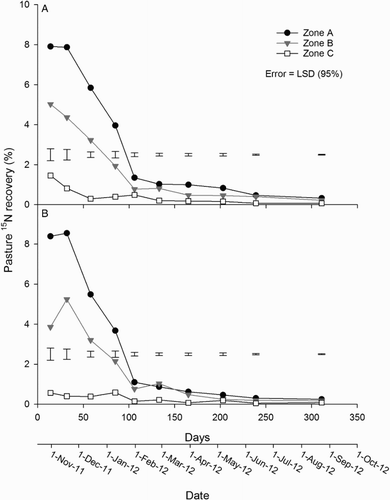
Table 1. Cumulative recovery of 15N in pasture and soil at day 106. There was no effect of fertiliser on 15N recovery.
Figure 8. Soil concentration at two depths (0–7.5 and 7.5–20 cm) in zones A, B and C for the A, urine + fertiliser; B, urine only; C, fertiliser only; and D, control treatments. Error bars = LSD (95%), n = 4. Note different scales on the y axes.
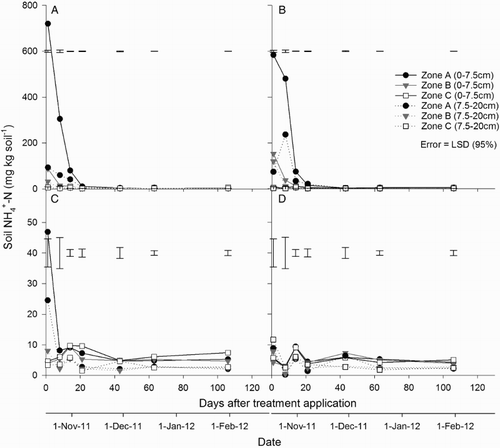
Figure 9. Soil concentrations at two depths (0–7.5 and 7.5–20 cm) in zones A, B and C for the A, urine + fertiliser; B, urine only; C, fertiliser only; and D, control treatments. Error bars = LSD (95%), n = 4. Note different scales on the y axes.
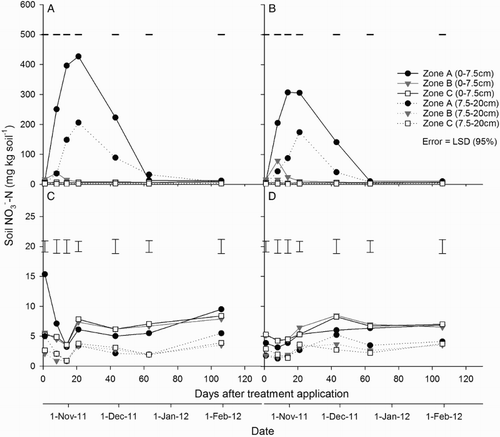
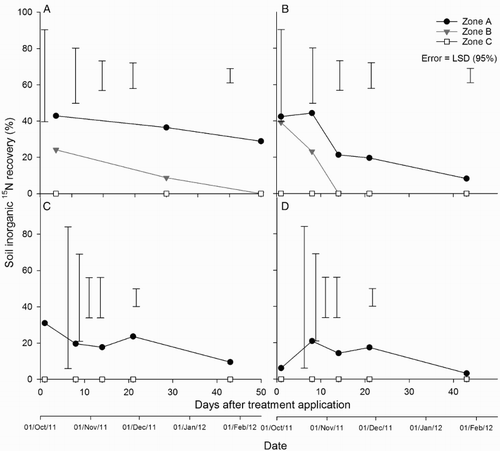
Figure 10. Soil inorganic 15N recovery for the A, urine + fertiliser at 0–7.5 cm depth; B, urine only at 0–7.5 cm depth; C, urine + fertiliser at 7.5–20 cm depth; and D, urine-only treatments at 7.5–20 cm depth. Error bars = LSD (95%), n = 4.