Figures & data
Figure 1. Pipeline of analysis of environmental genomics for applied pastoral productive and environmental outcomes. Collection of soil for environmental genomics can (and should) be made alongside analysis of other soil properties (pH, C, N, P, S, etc). Standard field sampling (corer with numerous subsamples across the field) and homogenisation of the soil sample allows for representative ‘DNA’ to be extracted. Extraction of eDNA from soils is now routine, with commercially available kits and service providers. Analysis of eDNA can be conducted using a range of different methods, most of which are accessible through service providers. Routine analysis, such as qPCR, can be conducted by most biologically focused research institutes. The approach for data will be highly dependent on the intended use for the researcher or farmer. For example, understanding how farm management pathways result in emergence of soil-borne disease suppression; this will require highly complex analysis based on ecosystem reconstruction. Many farmers, however, maybe interested in detection of key genes of interest for their farming system; e.g. are there sufficient rhizobia in the soil to enable clover nodulation, or what is the disease and pathogen load of a soil before pasture renovation (allowing for targeted pesticide use)? These analyses, therefore, enable ‘informed decision making’ that takes into consideration soil biological resources. The use of this approach builds, over time, an understanding of the normal operating range of farming systems, identifies new opportunities to alter the trajectory of emergence of functions, and provides a basis to benchmark performance and ideally build genetic gain.
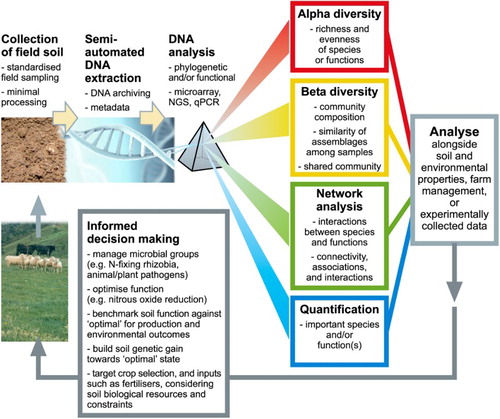
Figure 2. A, Clustering (group average, hierarchical agglomerative method) of samples showing the very strong effect of whole community genome amplification on the similarity and grouping of samples; B, second-stage nMDS ordination showing effects of separation of the data into different gene sets, and aggregation from probe values to subcategories. Treatments with an ‘N’ suffix indicate the data have been normalised. SC1, subcategory level 1 aggregation of the data.
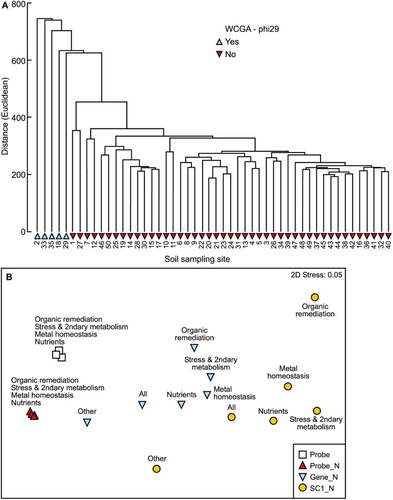
Table 1. Summary PERMANOVA results table testing the influence of land use and soil group on similarity in function (GeoChip5 data) of pasture soil ecosystems.
Table 2. Summary of multivariate stepwise selection of environmental and soil properties that best explain (Spearman correlation) variation in the GeoChip5 data among gene groups and with increasing level of aggregation.
Figure 3. A, Influence of soil type and land use on abundance of genes associated with production and catabolism of microbially produced plant growth regulatory genes (PGRGs). Error bars represent SEM; B, linear regression between soil total cobalt concentration and PGRGs. The 95% confidence interval is given in the shaded area.

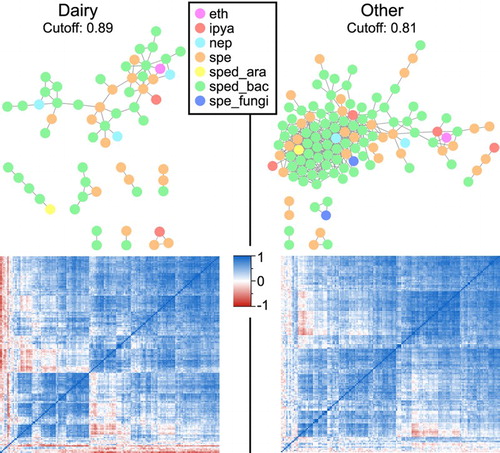
Figure 4. Network analysis of plant growth regulatory genes (PGRGs) in soils from under dairy or ‘other’ land use. Each node signifies a PGRG. The correlation (heat maps) underpinning the network graphs, with hierarchical clustering of the genes, are given below.