Figures & data
Figure 1. AgResearch urine sensor assembly (left) and attachment on a cow (right).
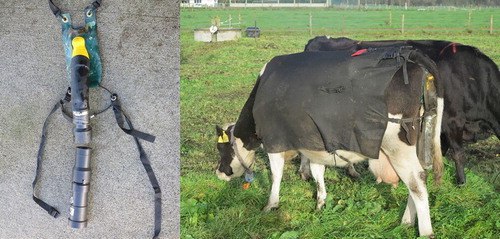
Table 1. Summary of nitrogen, potassium and sodium concentrations of the urine samples from different feed types used to evaluate refractive index. K and Na concentrations were not measured in urine from the mixed pasture. The average least significant difference value (LSD) for P = 0.05 is presented.
Figure 2. The relationship between N and K concentrations in urine from cattle fed monocultures of clover, ryegrass or turnips. Prediction confidence intervals for the 2.5th and 97.5th percentile intervals are shown.
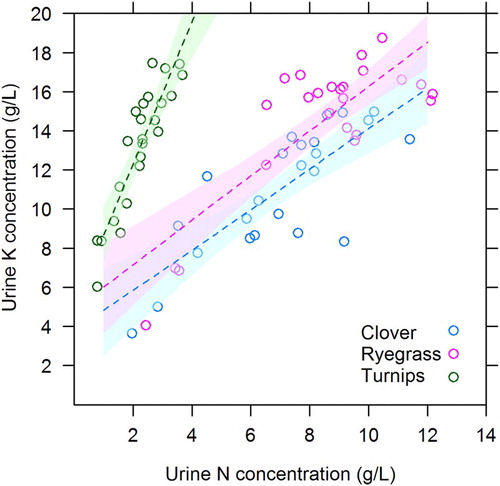
Figure 3. The regression between urine sensor refractive index (RI) value and urinary-N concentration from cows fed on ryegrass (n = 48 samples from six cows), clover (n = 48 samples from six cows), turnip (n = 46 samples from six cows) or a mixed ryegrass/clover pasture (n = 26). Prediction confidence intervals for the 2.5th and 97.5th percentile intervals are shown.
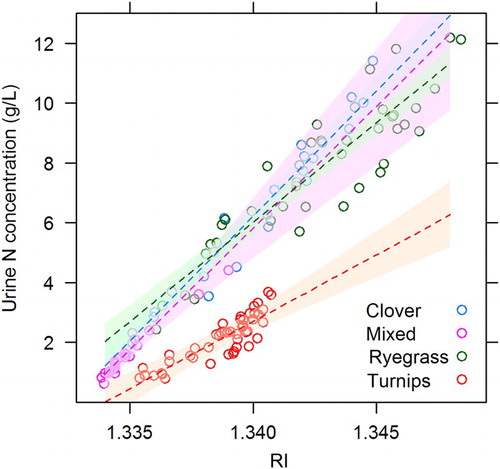
Table 2. Regression coefficients (with standard error) for the relationship between refractive index and urinary nitrogen and urinary potassium concentrations for each feed type.
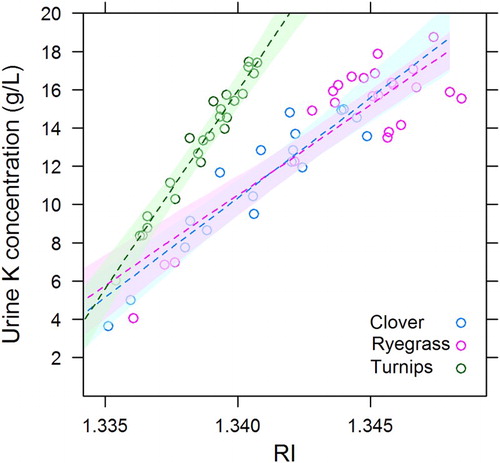
Figure 4. The regression between urine sensor refractive index (RI) value and urinary-K concentration from cows fed ryegrass (n = 24 samples from three cows), clover (n = 24 samples from three cows) or turnip (n = 24 samples from three cows). Prediction confidence intervals for the 2.5th and 97.5th percentile intervals are shown.