Figures & data
Table 1. Key soil fertility (0–7.5 cm) and physical properties for the Balmoral soil.
Table 2. Lysimeter treatment ID (It. ryegrass – IR; oats – OT) and urine application rates.
Table 3. Major tasks and dates for the field lysimeter experiment.
Table 4. Mean daily winter (June–August), spring (September–November), summer (December–February), and autumn (March–May) soil, air, solar radiation, and evapotranspiration values for 2013–2014 compared with recent LT 2000–2016 averages.
Figure 1. Daily rainfall, simulated rainfall/irrigation and cumulative rainfall for 2013–2014 and mean cumulative drainage for It. ryegrass (IR) and oats to November from the commencement of treatment application.
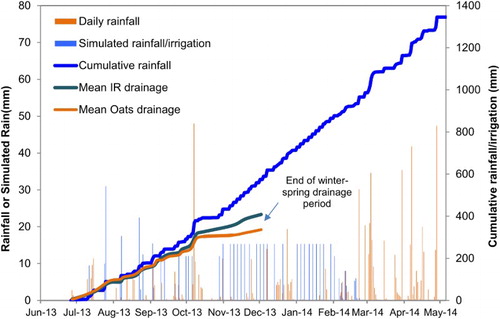
Figure 2. Nitrate concentration vs. cumulative drainage following the June/July urine applications (0, 350, and 700 kg N ha−1) for the It. ryegrass (A, top) and oats (B, bottom) lysimeter treatments. Time scale approximate only. Standard error bars (±1 SE) shown.
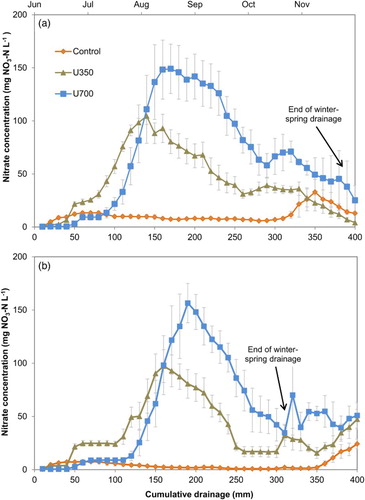
Table 5. Total inorganic-N leaching ( , , and total-N), drainage and inorganic-15N leaching losses for It. ryegrass and oats urine treatments (control, 350, and 700 kg N ha−1) to the end of the winter–spring drainage period.
Table 6. Annual total-N and 15N inorganic-N leaching loss (, , and total), gaseous-N loss (NH3-N and N2O-N), DM N content and soil-15N for It. ryegrass and oats urine treatments (control, 350, and 700 kg N ha−1).
Figure 3. Oats and It. ryegrass DM production (A) and 15N uptake (B) to the end of the winter–spring period (December 2013) after winter (June 2013) application of 15N-labelled urine. Standard error bars (±1 SE) shown.
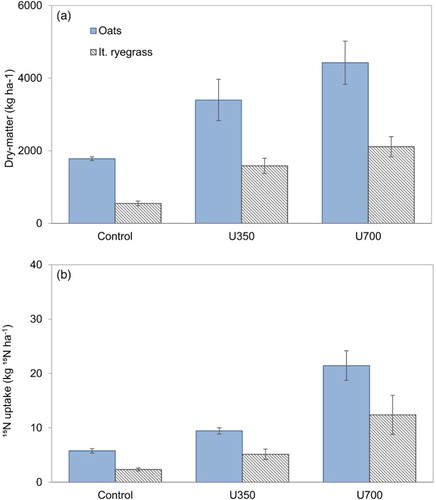
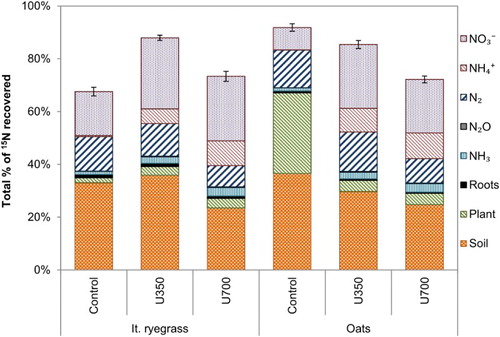
Figure 4. Summed total (%) of 15N recovered in drainage, soil, plant, and gaseous-N fractions from applied 15N-labelled urine or water. Standard errors (±1 SE) for total 15N recovery shown.