Figures & data
Figure 1. Colony morphology of Epichloë endophytes isolated from Hordeum brevisubulatum after incubation on PDA at 25°C for 32 d. A, surface of WBE1; B, reverse of WBE1; C, surface of WBE3; D, reverse of WBE3; E, surface of WBE4; F, reverse of WBE4. Bar = 3 cm.
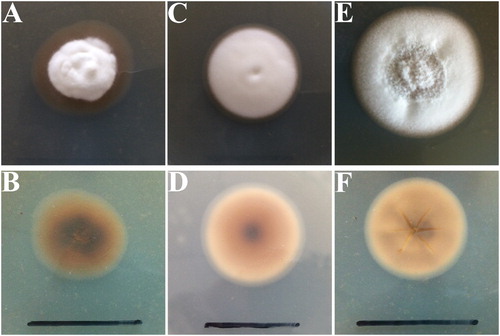
Figure 2. Conidiogenous cells and conidia of Epichloë endophyte isolated from Hordeum brevisubulatum after incubation on PDA at 22°C. A, Conidia (white arrow) and conidiogenous cells (black arrow) of WBE1; B, Conidia (white arrow) and conidiogenous cells (black arrow) of WBE3; C, Conidia (white arrow) and conidiogenous cells (black arrow) of WBE4. Bar = 20 μm.
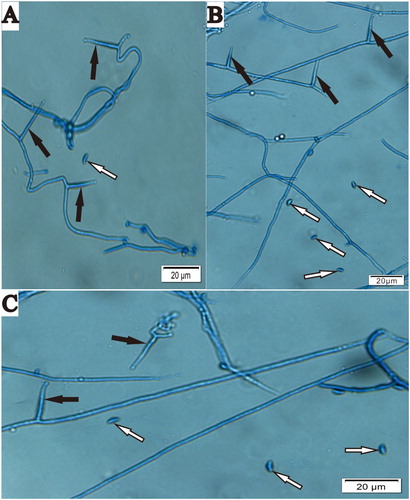
Table 1. Morphological characteristics of Epichloë bromicola isolated from Hordelymus europaeus, Leymus chinensis, Elymus spp., Roegneria kamoji, Bromus spp. and Epichloë endophytes isolated from Hordeum spp.
Figure 3. Molecular phylogeny derived from maximum likelihood (ML) analysis of introns of tefA gene from representative Epichloë species and endophyte WBE1,3,4 isolated from Hordeum brevisubulatum. Evolutionary history was inferred using ML method based on the Kimura 2-parameter model. The tree with highest log likelihood (−1293.4036) is shown. The percentage of trees in which associated taxa clustered together is shown next to branches. Initial tree(s) for heuristic search were obtained by applying the neighbour-joining method to a matrix of pairwise distances estimated using the maximum composite likelihood approach. The tree is drawn to scale, with branch lengths measured in number of substitutions per site. The analysis involved 28 nucleotide sequences, and the final dataset had 421 positions. Host designations are shown in parentheses after endophyte.
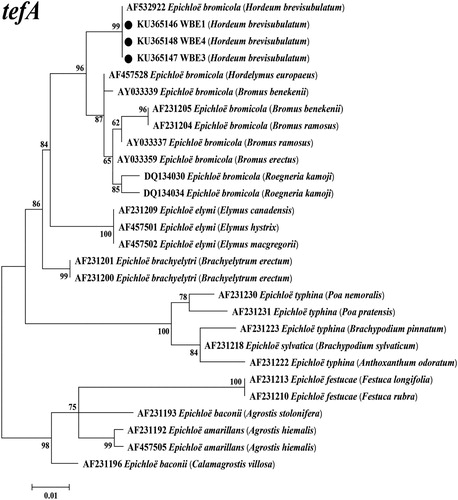
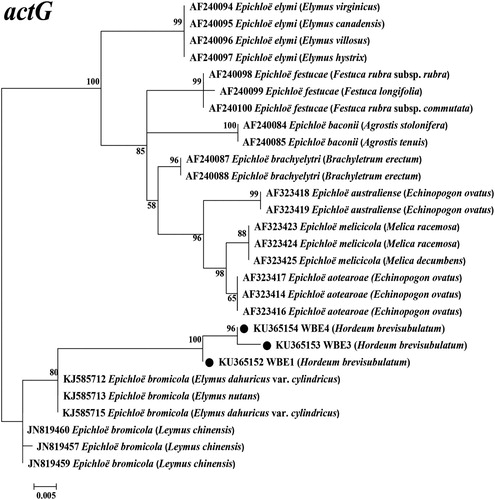
Figure 4. Molecular phylogeny derived from maximum likelihood (ML) analysis of introns of actG gene from representative Epichloë species and endophyte WBE1,3,4 isolated from Hordeum brevisubulatum. Evolutionary history was inferred by using the ML method based on Kimura 2-parameter model. The tree with highest log likelihood (−997.5261) is shown. The percentage of trees in which associated taxa clustered together is shown next to branches. Initial tree(s) for heuristic search were obtained by applying the neighbour-joining method to a matrix of pairwise distances estimated using the maximum composite likelihood approach. The tree is drawn to scale, with branch lengths measured in number of substitutions per site. The analysis involved 28 nucleotide sequences, and the final dataset had 399 positions. Host designations are shown in parentheses after endophyte.