Figures & data
Figure 1. Diagrammatic representation of expected capital gains assumptions (blue line) relative to operating profit (green line), with expected capital gains being either at a constant real value (dashed blue line from T = 1) or at the same proportion of operating profit (solid blue line from T = 1).
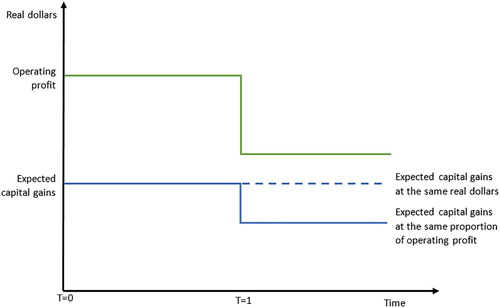
Table 1. Effects of modelled N regulations on dairy farm land values in Southland.
Table 2. Effects of modelled P regulations on dairy farm land values in Southland.
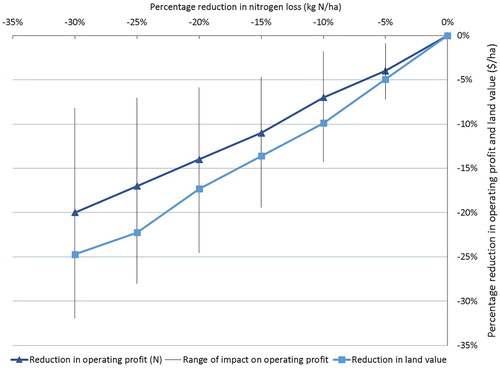
Figure 2. Impact of N loss regulation on operating profit and land value, for the 76% of modelled farms that could mitigate to a 30% reduction in N loss. Dark blue data series is the average impact of reducing N loss on operating profit. The light blue data series is the associate average impact on land values. The black bars represent the range of impacts that reducing N loss had on the operating profit of the case study farms.