Figures & data
Table 1. The timing of lucerne sample collection from stands at Lincoln and Springston.
Table 2. Damage severity score categories for fungal and insect damage (from James Citation1971; Harvey & Martin Citation1980).
Table 3. The refined list of variables used to predict coumestrol content of a lucerne crop, following removal of obsolete, collinear parameters.
Figure 1. The relationship between coumestrol content (mg/kg DM) of lucerne and days above 95% RH that the lucerne crop had been exposed to with 95% confidence interval (long-dashed lines) and prediction interval (short-dashed lines). Dotted line is the critical level (25 mg/kg DM) above which lucerne is reported to be a risk for ewe reproductive performance. Data from Lincoln, Canterbury, NZ in 2014 (◇), 2015 (○) and 2016 (×), and from Springston, Canterbury, NZ in 2015 (◆).
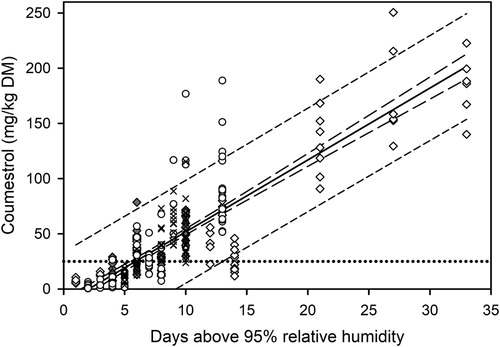
Table 4. The variables identified via best subsets regression as best relating to coumestrol content of lucerne.
Figure 2. Coumestrol content (mg/kg DM) against fungal damage score of lucerne at Lincoln, Canterbury, NZ in 2014 (◇), 2015 (○) and 2016 (×), and from Springston, Canterbury, NZ in 2015 (◆). The relationship (R2 = 0.578) is described by the equation: y = 100.40x + 0.11 with 95% confidence interval (long-dashed lines) and prediction interval (short-dashed lines). Dotted line is the critical level (25 mg/kg DM) above which lucerne is reported to be a risk for ewe reproductive performance.
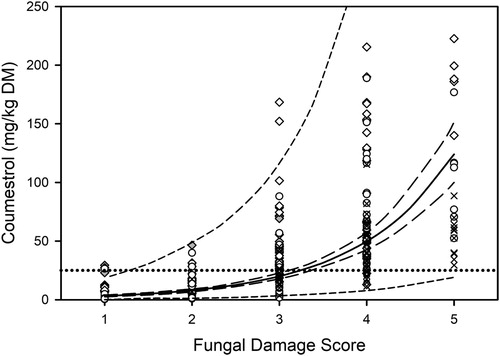
Table 5. Equations for the prediction of coumestrol content of lucerne (mg/kg DM) from the days above 95% RH and/or the sum of rainfall (mm) during the growing period.
Figure 3. Reported (y) versus predicted (x) coumestrol content (mg/kg DM) of independent data using Equation (3) (Graph A; r = 0.813) and all data using Equation (4) (Graph B; ). The solid regression line in Graph A is described by the equation y = 1.44x + 9.27 and the dashed line is the identity line. For Graph B long-dashed lines are the 95% confidence interval and short-dashed lines are the prediction interval. Dotted line is the level (25 mg/kg DM) above which lucerne is a risk for ewe reproductive performance. Independent data in Graphs A and B are sourced from Logan, Utah, USA in 1961 (●); Brookings, South Dakota, USA in 1963 (▪); Lincoln, Canterbury, NZ in 1980 (▴) and 2016 (▾); and Oamaru, North Otago, NZ in 2015 (▪). Original data in Graph B sourced from Lincoln, Canterbury, NZ in 2014 (◇), 2015 (○) and 2016 (×), and from Springston, Canterbury, NZ in 2015 (◆).
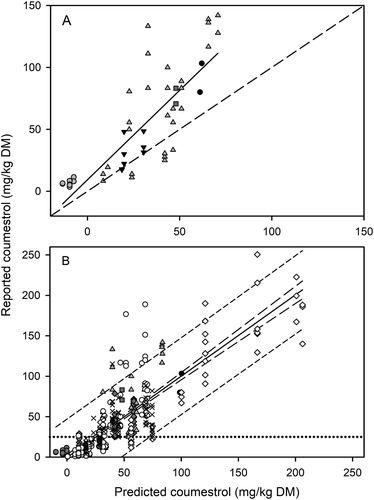
Figure 4. A decision tree to estimate mean coumestrol content of lucerne based on rainfall (mm) and the days above 95% RH that the stand was exposed to during its regrowth period. The regrowth period was the interval between the day forage was removed and the time of sampling, which ranged from four to eight weeks later.
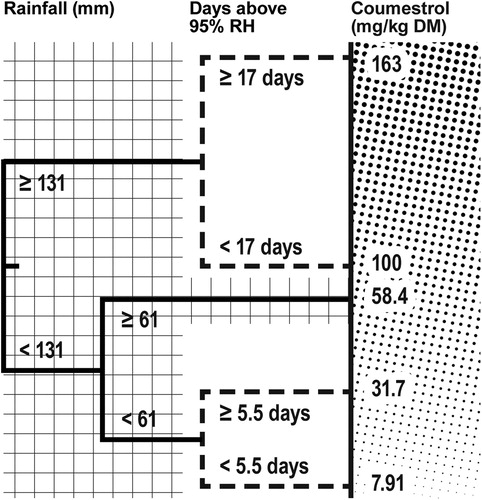
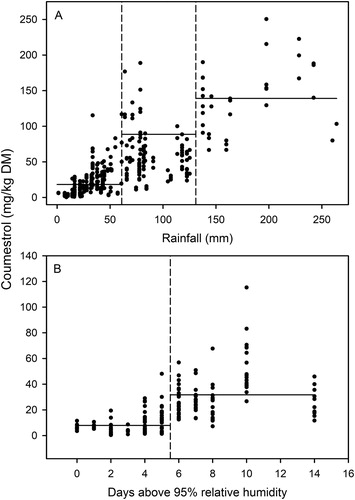
Figure 5. Graph A. Coumestrol content of lucerne plotted against the sum of rainfall (mm) during the regrowth period of plant samples. From left: horizontal lines are mean coumestrol contents for rainfall less than 61 mm, between 61 and 131 mm, and above 131 mm. Graph B. Coumestrol content of lucerne against days above 95% RH for samples with rainfall less than 61 mm during the regrowth period. From left: horizontal lines are mean coumestrol contents for fewer than 5.5 days over 95% RH and more than 5.5 days over 95% RH.