
Figures & data
Table 1. The year in which each herbicide resistance case in New Zealand was documented and the land-use type in which it was found. Herbicide Mode-of-Action classifications as defined by the Herbicide Resistance Action Committee https://hracglobal.com.
Table 2. An estimate of the number of farms (and the area in thousands of hectares within brackets) within administrative regions that share weed and land-use histories with previously published cases of herbicide resistance (farm types follow Agribase™).
Figure 1. Herbicide resistant ryegrass in a vineyard in Marlborough. Picture: Trevor James.
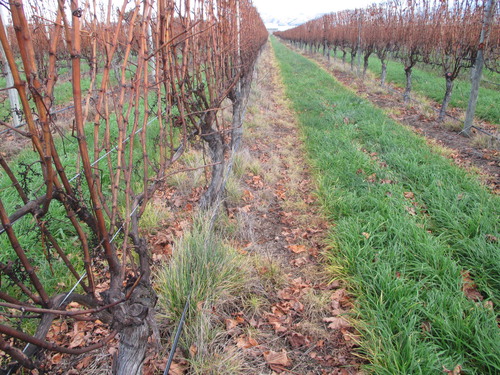
Figure A1. The proportion of survey simulations in which every case of resistance was missed. Panel headers show the percent of population samples, panel rows show the size of the sample population (number of farms). For simulations with farm numbers higher than 3000 some cases of resistance were detected in all simulations.
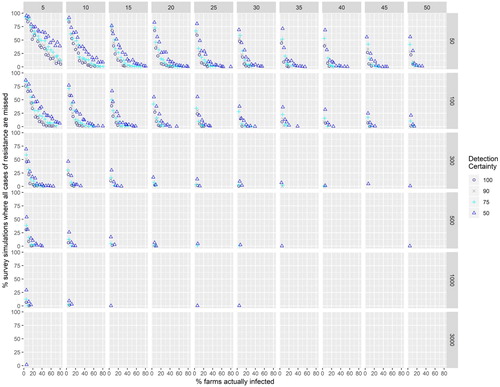
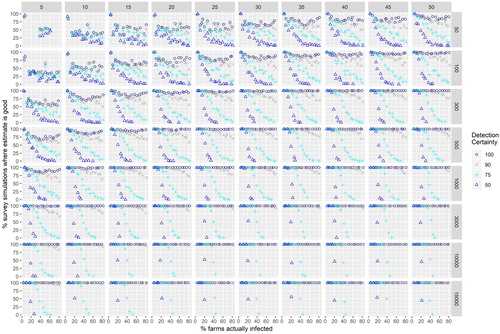
Figure A2. The proportion of survey simulations in which an estimate of resistance is obtained within 10% of the actual level of resistance. Panel headers show the percent of population samples, panel rows show the size of the sample population (number of farms). An absence of observations within 10% of the value results in no points being plotted.