Figures & data
Figure 1. Overview of the spatial location of the Waituna Lagoon Catchment (Southland, New Zealand) and spatial data used to establish EoFM feasibility. Shown are the DEM (A), soil type (B), landuse (C) and contributing creeks (D).
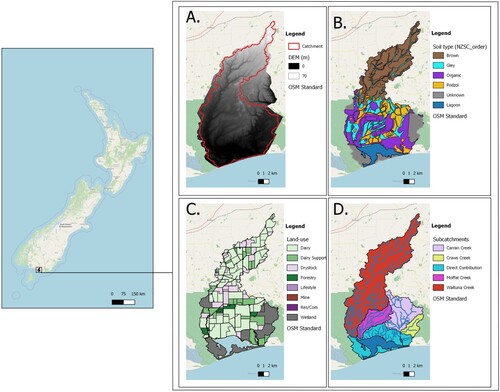
Table 1. Estimated proportion (%) of N and P loads intercepted by different EoFM devices in on-farm catchments with and without tile drainage based on nutrient losses in drainage in a nearby catchment (Monaghan et al. Citation2016) and using the upper limit of a EoFM efficiency study in Southland (Hughes et al. Citation2013). In Equation (1), these values are used as a factor, i.e. for wetlands this is 0.9 for tile drained and 0.5 for non-tile drained; and for other EoFM, it is 0 or 0.9.
Table 2. Seasonal nitrogen load reductions (% of influent load removed) by EoFM devices.
Table 3. Seasonal phosphorus load reductions (% of influent load removed) by EoFM devices.
Table 4. Price of EoFM by size of device. In Equation (3), mitigation cost is used on m2 basis, but costs are shown based on the field-trial size as the relative efficiency by size varies greatly between these mitigations. Sources are McKergow et al. (Citation2015) and Tanner et al. (Citation2013) updated to 2017. The difference between these costs has been explained in Section 2.6.
Table 5. Price of EoFM as shown in translated to price per ha of contributing catchment. Only the costs that vary per EoFM size are shown.
Figure 2. Presence and characterisation of on-farm-catchments in the Waituna Lagoon Catchment. Per on-farm-catchment larger or equal to 5 hectares (ha), the outflow location, potential wetland area and presence of artificial drainage are shown. Inset 1 focusses on a larger than 5 ha artificially drained on-farm-catchment with a large potential wetland area near the outflow location. Inset 2 focusses on a larger than 5 ha on-farm-catchment area with no artificial drainage and a potential wetland area near the outflow location. The outflow locations are at first or higher order streams.
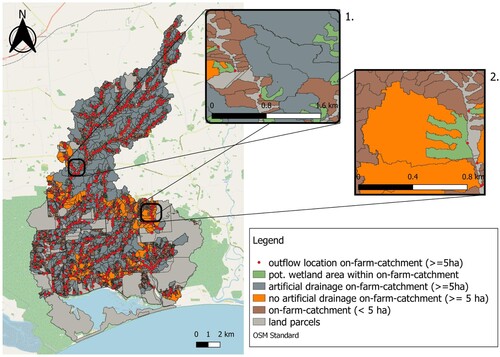
Figure 3. Boxplots showing the range of sizes for the on-farm-catchment area (catchment, selected for >5 ha) and available potential wetland area located in >5 ha on-farm-catchments (pot. wetland). On the boxplot, the middle line indicates the median, the upper box the 75 percentile, the lower box the 25 percentile, end of the top line the 95 percentile and end of bottom line 5 percentile.
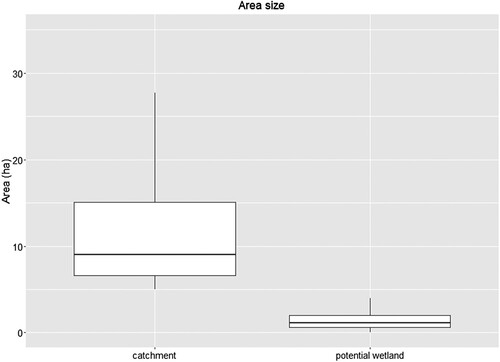
Figure 4. Price per hectare mitigated per EoFM for on-farm-catchments (selected for >5 ha). 3% wetland (orange), 5% wetland (red), woodchip filter (blue) and zeolite filter (black). The dots on the lines are on-farm-catchment sizes where potential EoFM can be applied based on location suitability in the Waituna Lagoon Catchment.
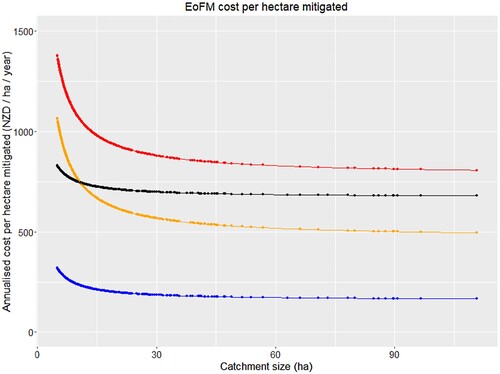
Figure 5. Distribution of cost per kg N reduced for constructed wetland and denitrifying bioreactor EoFM when applied to applicable on-farm-catchments in the Waituna Lagoon Catchment. Outliers are omitted from the figure. On the boxplot, the middle line indicates the median, the upper box the 75 percentile, the lower box the 25 percentile, end of the top line the 95 percentile and end of bottom line 5 percentile.
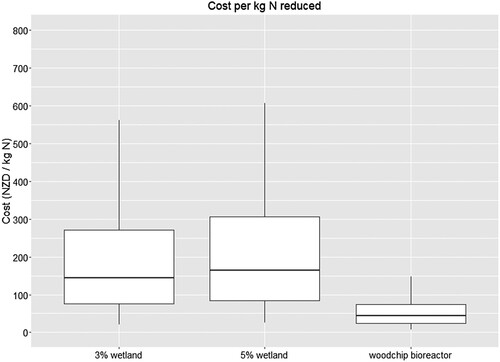
Figure 6. Distribution of cost per kg P reduced for each when applied to applicable on-farm-catchments in the Waituna Lagoon Catchment. Outliers are omitted from the figure. On the boxplot, the middle line indicates the median, the upper box the 75 percentile, the lower box the 25 percentile, end of the top line the 95 percentile and end of bottom line 5 percentile.
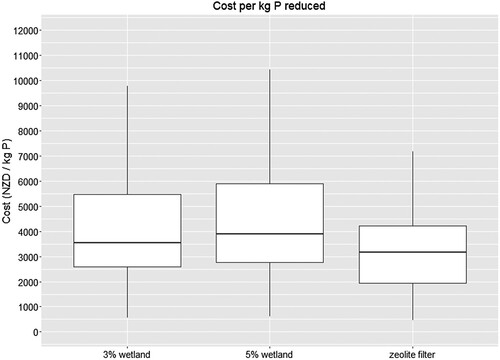
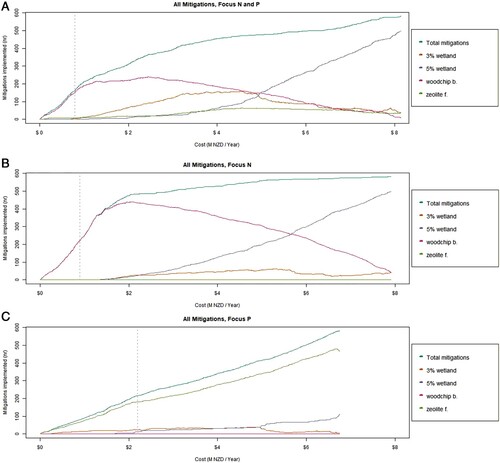
Figure 7. Optimal investment in EoFM based on farm-based cost-effectiveness approach (Farm) and catchment-based cost-effectiveness approach (Watershed) for N and P reduction of the received load for >5 ha on-farm-catchments in the Waituna Lagoon Catchment independent of EoFM used for mitigation. These abatement curves are shown with no preference for mitigating either N or P (A), mitigating with focus on N (B) and mitigating with focus on P (C). The dotted reference lines indicate the approach threshold when the farmer-based abatement curve becomes less cost effective on a catchment scale compared to the catchment-based abatement curve.
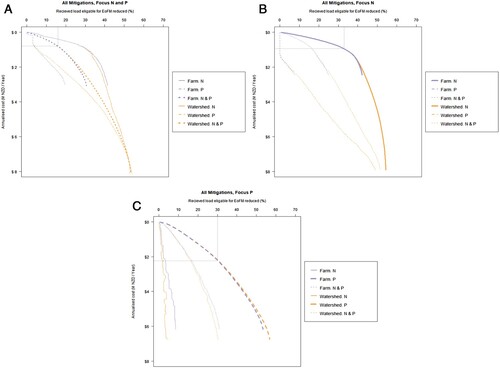
Table 6. Overview of abatement curve maximum for EoFM placement in the Waituna Lagoon Catchment. These results are assessed for an N & P, N and P focused mitigation placement strategy and a farm-based and catchment-collective cost-effective mitigation placement strategy. The approach threshold indicates when the farm-based approach becomes less cost-effective compared to the catchment-collective approach.
Figure 8. EoFM selection is based on a catchment-based approach for N reduction and P reduction in the Waituna Lagoon Catchment with focus on both nutrient loads (A), mitigation with focus on N (B) and mitigation with focus on P (C). The dotted reference lines indicate the approach threshold when the farmer-based abatement curve becomes less cost effective on a catchment scale compared to the catchment-based abatement curve.