Figures & data
Table 1. Timing and brief description of, and references for major farm systems experiments at No. 2 Dairy between 1944 and 2004.
Table 2. Summary results from a series of experiments investigating the effect of grazing strategy (Rotational Grazing: RG; Set Stocking: SS) on milk and pasture production, and how these effects were modified by interacting system-level factors: stocking rate (SR) and cow genetic merit (GM)Table Footnotea.
Figure 1. Daily pasture growth rate (vertical bars; kg DM/ha/d) and per ha DMI of dairy cows at 2 stocking rates, 2.2 (![]()
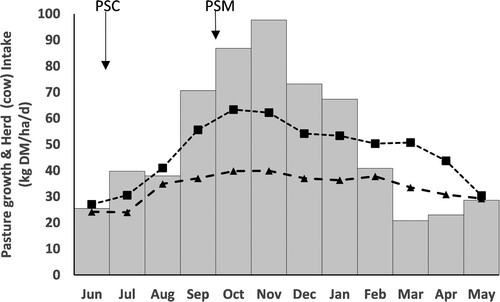
Table 3. No. 2 dairy experiment design for 1982/83 & 1983/84 for autumn-winter (April to July), (Experiment 13, Phase 1: Adapted from Bryant and L'Huillier Citation1986).
Table 4. Experimental design at No. 2 dairy for 1984/85 and 1985/86. (Experiment 13, Phase 2: adapted from Bryant and L'Huillier Citation1986).
Table 5. Effect of differing rotation lengths on farm cover (kg DM/ha) and subsequent milksolids production (Experiment 18; 1989/90).
Figure 2. Relationship between proportion of farm grazed during April, May and June, and the amount of pasture on the farm in July (Experiment 13, Phase 1).
Note: A rotation of 100 days means that 1/100th of the farm was grazed each day.
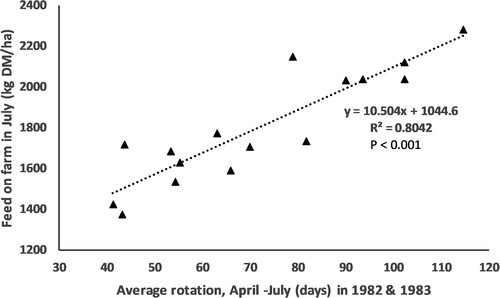
Figure 3. The effect of rotation length in a winter-spring feed deficit on the long-term pasture cover (i.e. feed availability; Experiment 13 Phase 2). Treatments were: a slow rotation prior to calving and post-planned start of calving (![]()
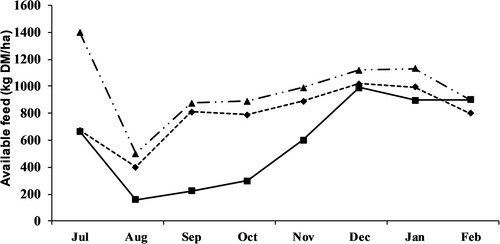
Figure 4. The spring rotation planner dictates how much area should be allocated each day from calving to 'balance day' (i.e., when pasture growth is equal to herd demand). The farmer must ration this area between dry and lactating cows. The area allocated increases with time, matching the increasing number of cows calved and the greater dry matter intake of lactating cows (Developed from Experiment 13 & 15). The provided example is a 100 ha farm with a planned start of calving in early July. Rotation length (![]()
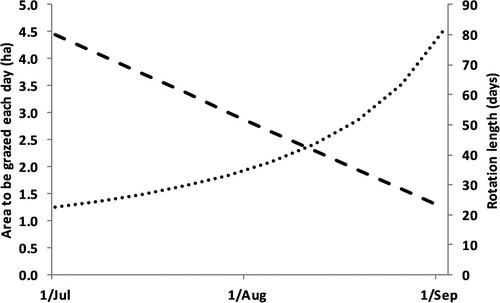
Figure 5. The autumn rotation planner developed from autumn-winter grazing management experiment that dictates how much area can be allocated each day. This area is rationed between dry and lactating cows to ensure dry cows are allocated enough for condition score gain, while the milkers are allocated enough for maintenance and milk production. The provided example is for a 100 ha farm, with a planned start of calving (PSC) in early July. Rotation length (![]()
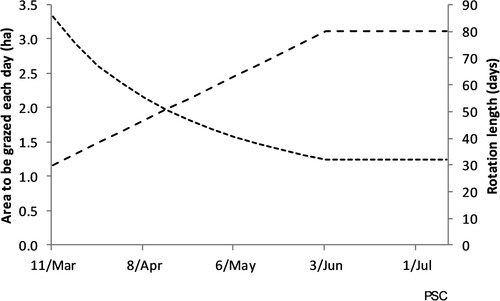
Figure 6. Live weight gain profile of animals from weaning (9 weeks) until post-calving in their third lactation: A = ![]()
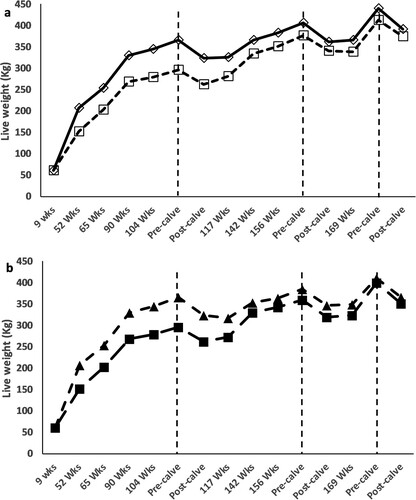
Table 6. Effects of grazing management strategyTable Footnotea as replacement heifers (pre-calving) and during lactation (Lactating) on annual milk fat yield/cow (kg; estimatedTable Footnoteb MS (fat and protein) yields in parentheses).
Figure 7. Live weight targets for Jersey calves from 9 wks of age until pre-calving at 24 mo (i.e. the ‘Plunket graph’; Adapted from McMeekan Citation1954). The middle line depicts the desired growth rate with the bottom being below the target and the top line being above the target.
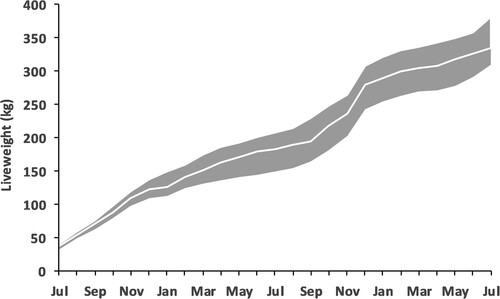
Figure 8. Average annual pasture growth (t DM/ha/yr; ) for No 2 Dairy over 5 yr periods (estimated for 1960s & 1970s using 15.0 kg DM/kg MS; from 1979 growth calculated from weekly farm walks).
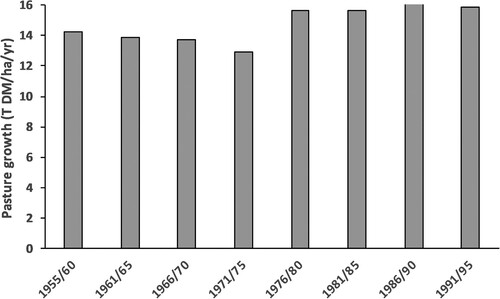
Table 7. Summary of Whole Farm Efficiency experiment: experimental design, and summary pasture growth, and production results (Experiment 24).
Figure 9. The effect of stocking rate (cows/ha) on pasture harvest (t DM/ha; 
 ), milksolids production/ha (kg;
  ) and operating profit/ha (NZ$;
  ), and nitrate leached/ha (kg;
  ). Methane emissions/ha were estimated from the equation: kg DM × 21.6 (Clark Citation2008, Macdonald et al. Citation2008b, Citation2011. Roche et al. Citation2016).
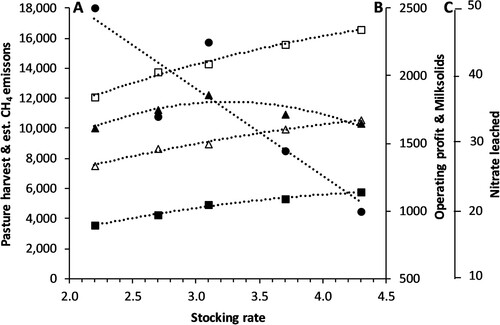
Table 8. Treatment details for 1.75 t MS/ha experiment (Experiment 21; Phase 1; 1993–1995 adapted from Penno et al. Citation1996).
Table 9. Experimental design, and summary production and economic results (for the 1.75 t MS/ha experiment ( Least square means over 3 years: 1995/96–1997/98). Effects of nitrogen fertiliser use, stocking rate, and supplementary feeding on modelled per ha greenhouse gas (GHG) emissions are presented (Experiment 21; Phase 2; adapted from Macdonald Citation1999 & Macdonald et al. Citation2017).
Table 10. The effects of grazing strategy (Controlled vs Uncontrolled), Stocking rate (Low: 2.35 cows/ha vs High: 2.95 cows/ha), and cow genetic merit (HGM vs LGM) on milk fat production/cow and per ha and the % increase in milk production from genetic merit, stocking rate, and grazing strategy (Experiment 5).
Table 11. Principal results summarising the effects of stocking rate and breed on pasture and animal production variables and economic outcomes (Experiment 19; from Spaans et al. Citation2018).
Table 12. Summary data for the three strains of Holstein-Friesian from birth to end of second lactation (Experiment 26).
Figure 10. Body condition score for the three strains of Holstein-Friesians over consecutive lactations that were evaluated at a range of feeding allowances in Experiment 26: 'The Dexcel Strain Trial'. (![]()
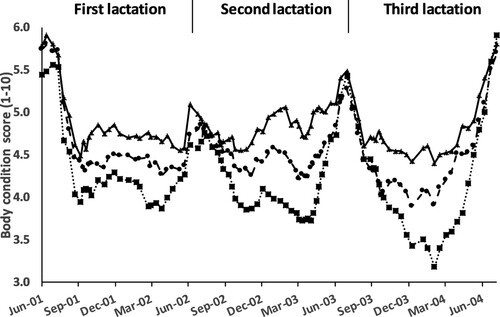
Table 13. Lactation lengths, yields of milk, milk fat and protein, and operating profit for herds of cows calving in July, October, January and April (Experiment 25; adapted from Spaans et al. Citation2019).
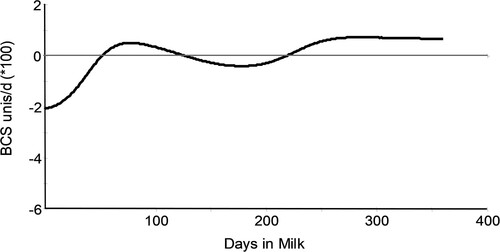
Figure 11. Daily rate of change in BCS in pasture-based cows. Profile derived from the average BCS profile of 1172 cows across 3209 lactations at No. 2 Dairy between 1986 and 2004. Source: Roche et al. (Citation2007a).