Figures & data
Table 1. Descriptive statistics for three dairy goat farms, located in Waikato, New Zealand, within the July 2019–June 2020 production year.
Figure 1. The timeline of locomotion scoring events for each dairy goat farm A, B and C- located in Waikato, New Zealand. The x-axis is the month starting in the first week of July 2019 and ending in the third week of June 2020.
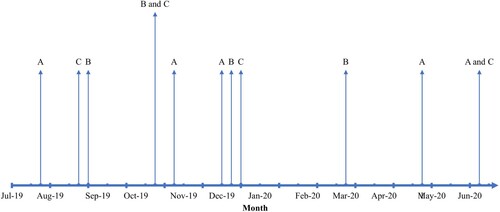
Table 2. Locomotion scoring strategy used to measure lameness in dairy goats (adapted from Deeming et al. Citation2018).
Figure 2. The prevalence of clinical lameness (locomotion severity scores 3 or 4) in dairy goats across three New Zealand farms (A, B, and C) during the 2019–2020 production year.
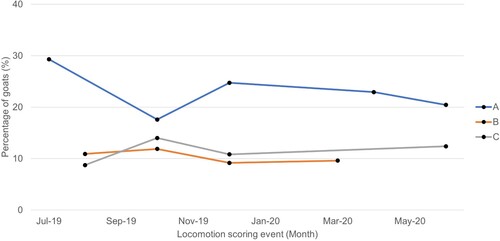
Table 3. Number of dairy goats at each locomotion scoring event between July 2019 and June 2020 across the three commercial farms in New Zealand. The percentage of dairy goats scored at least once at each scoring event are displayed in parathesis.
Table 4. Average prevalence and annual incidence rates (with 95% confidence intervals in parenthesis) of lameness and clinical lameness in dairy goats within three New Zealand commercial farms across the 2019–2020 production year.
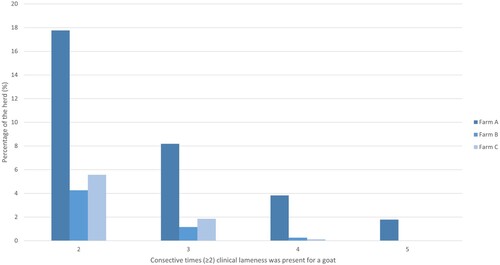
Figure A1. Percentage of dairy goats within the herd with consecutive clinical lameness events (locomotion score 3 or 4) across recording events within the 2019–2020 production year in three commercial farms (A, B and C). Farms were in Waikato, New Zealand.