
Figures & data
Figure 1. Management calendar describing main activities for all plots, including specific tillage operations at FIT plots. Fertility sampling (S) occurred following the renovation of pastures, approximately 18–, 13–, and 8–months following tillage for Trials 1, 2 and 3, respectively.
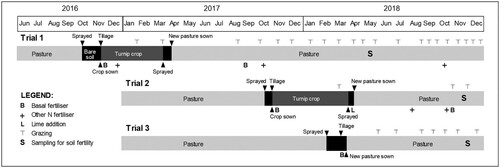
Table 1. Soil chemical properties determined for each trial site prior to the tillage treatments and fertility assessments (from Calvelo- Pereira et al. Citation2019; Calvelo-Pereira et al. Citation2022).
Figure 2. Distribution of total soil C and N concentrations with soil depth under tillage treatments and CP at (a) Trial 1 (b) Trial 2 and (c) Trial 3. At a given trial and soil depth interval, plotted points (means and standard error of mean) with the same letter(s) are not significantly (P > 0.05) different.
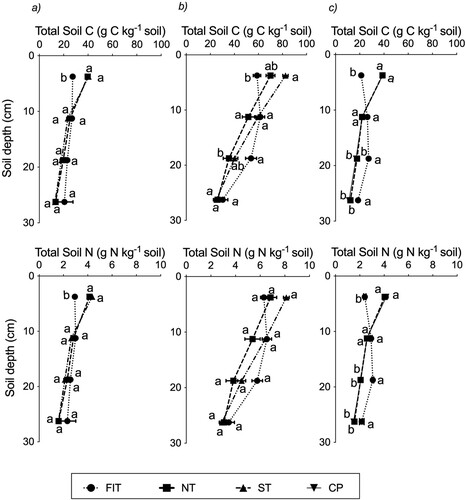
Table 2 . Vertical depth distribution of average pH, CEC, Ca, Mg, K and Na, and bulk density (BD) under tillage treatments and CP at each trial. At a given trial, variable, and soil depth interval, means with no or same letter(s) are not significantly (P > 0.05) different.
Table 3 . The amounts (kg ha−1) of nutrients applied in fertiliser and transferred by grazing animals during the periods of seedbed preparation and crop and pasture growth in Trial 1(grazed by dairy cows), Trial 2 (grazed by young bulls and sheep), renewal: old pasture – summer leafy turnip crop – new pasture, and Trial 3 (grazed by dairy cows), renewal: old pasture –new pasture.
Figure 3. Regression outputs between CEC and soil C at (a) Trial 1 (b) Trial 2 and (c) Trial 3, using data from the various depth intervals. **P < 0.01, ***P < 0.001.
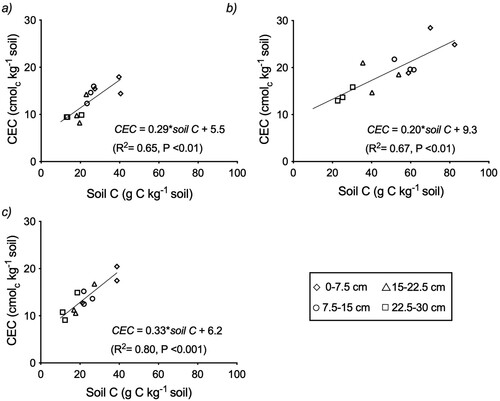
Figure 4. Distribution of Olsen P concentrations with soil depth under the tillage treatments and CP at (a) Trial 1 (b) Trial 2 and (c) Trial 3. At a given Trial and soil depth interval, plotted points (mean and standard error of mean) with the same or no letter(s) are not significantly (P > 0.05) different.
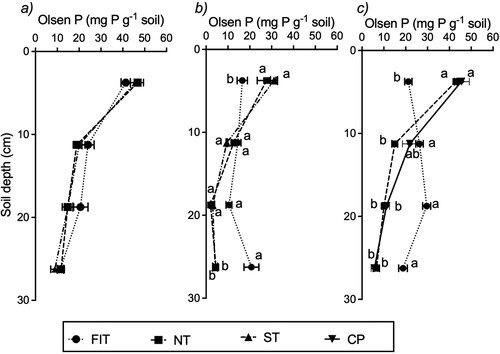
Figure 5. Element concentration (%): (a) N, (b) P, (c) K, and (d) Mg for crop and pasture herbage samples. For each element, the ranges of concentration highlighted correspond to normal range for Brassica and optimum range for mixed pasture (Morton and Roberts Citation2016; Roberts and Morton Citation2016; Morton et al. Citation2020).
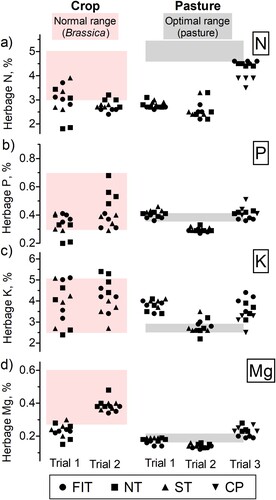
Table 4. Mean herbage dry matter (DM, kg ha−1) and nutrient (N, P, K, Mg, kg ha−1) accumulated in the crop phase and first pasture grazing in Trial 1(grazed by dairy cows), Trial 2 (grazed by young bulls and sheep), renewal: old pasture – summer leafy turnip crop – new pasture, and Trial 3 (grazed by dairy cows), renewal: old pasture – new pasture. For each variable, considering either crop or pasture and each trial independently, the effect of treatment (i.e. NT, ST, FIT, or CP) was tested following a one-way ANOVA; at a given trial, herbage, and variable, means with no or same letter(s) are not significantly (P > 0.05) different.
Supplementary table 1
Download MS Word (23.5 KB)Data availability
The data from this study are available upon request.