434
Views
4
CrossRef citations to date
0
Altmetric
Research articles

Characterisation of SSR markers for New Zealand Craspedia and their application in Kahurangi National Park

, &
Pages 60-73 | Received 23 Jul 2014, Accepted 16 Dec 2014, Published online: 27 Feb 2015

Figures & data

Table 1 Localities and putative informally named Craspedia species.

Figure 1 Leaves of seven forms of Craspedia. A,C. elongata’; B,C. long hairs’ (Mt Arthur); C,C. marble’; D,C. long hairs’ (Thorns Creek); E,C. calcicole’; F,C. Owen’; G,C. Mytton’.
Figure 1 Leaves of seven forms of Craspedia. A, ‘C. elongata’; B, ‘C. long hairs’ (Mt Arthur); C, ‘C. marble’; D, ‘C. long hairs’ (Thorns Creek); E, ‘C. calcicole’; F, ‘C. Owen’; G, ‘C. Mytton’.
Figure 2 Sampling locations in Nelson Province.

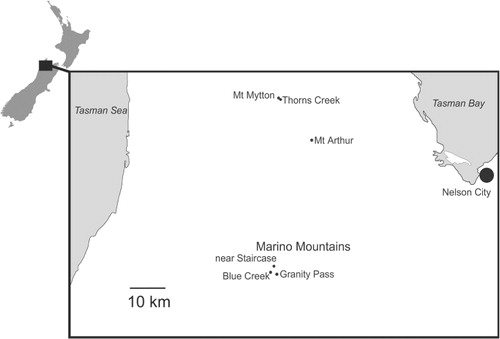
Table 2 Details of the simple sequence repeat markers characterised in this study.

Table 3 Summary statistics for SSR markers characterised in this study.

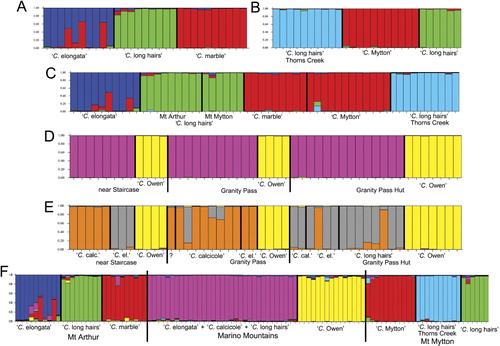
Table 4 Values of K (the number of populations) for each structure analysis undertaken as indicated by comparison of ΔK and mean lnPr(X|K).

Figure 3 Structure bar-plots based on analyses of 12 SSR markers for putative Craspedia species from Kahurangi National Park, New Zealand. A, Mt Arthur K = 3; B, Mt Mytton with K = 3; C, Mt Arthur and Mt Mytton analysed together with K = 4; D, Marino Mountains with K = 2; E, Marino Mountains with K = 3 showing also collecting locality and field ID. ‘?’ indicates a sample identified as intermediate in morphology in the field; F, all samples analysed together with K = 6.
Figure 4 Neighbour-joining tree for population genetic distances based on 12 SSR markers among populations of Craspedia sampled in this study. Colours of labels match those used in .
Figure 4 Neighbour-joining tree for population genetic distances based on 12 SSR markers among populations of Craspedia sampled in this study. Colours of labels match those used in Fig. 3.

Reprints and Corporate Permissions

Please note: Selecting permissions does not provide access to the full text of the article, please see our help page How do I view content?

To request a reprint or corporate permissions for this article, please click on the relevant link below:

Academic Permissions

Please note: Selecting permissions does not provide access to the full text of the article, please see our help page How do I view content?

Obtain permissions instantly via Rightslink by clicking on the button below:

If you are unable to obtain permissions via Rightslink, please complete and submit this Permissions form. For more information, please visit our Permissions help page.