Figures & data
Figure 1. Darwin Harbour map with sites sampled in the study highlighted as black dots. Inset map shows location of Darwin (red dot).
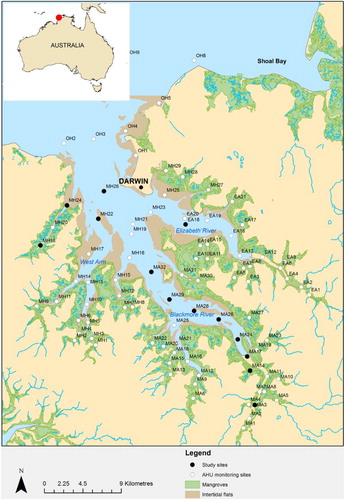
Figure 2. A, Darwin Harbour flushing times in days during the dry season (after Fortune & Maly Citation2009); B, newly proposed zonation of the harbour system by the AHU in Darwin based on water quality characteristics (after Fortune Citation2015); C, Darwin harbour dry season 2013 sampling sites ringed in yellow and placed within the mid and upper harbour zones.
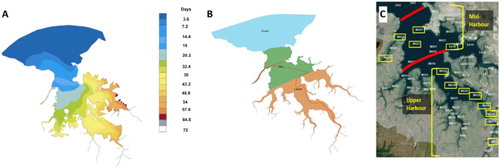
Figure 3. Darwin tide chart for 22 September 2013, on the left with the actual tide height changing based on a 6-min data (BoM), and insert below showing a detailed version of the tide variance in Darwin Harbour during our sampling period highlighted in the black box from 0700 h to 1200 h local time on 22 September 2013. Reproduced with kind permission from the Bureau of Meteorology (BoM).
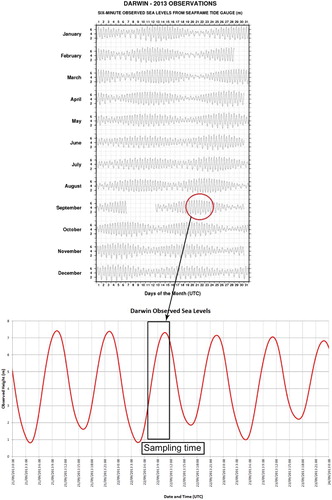
Table 1. Environmental parameters recorded during sampling at each site in Darwin Harbour using two multi-probe units: YSI unit and Sea-Bird unit (see ‘Methods’ section for details). Values are the arithmetic mean at the surface (c. 5 m) from each site during in situ sampling.
Figure 4. Nutrient data from all sites, including total nitrogen and phosphorus A, speciation of nitrogen and phosphorus (B) and carbon (C) analysed from surface sea water samples, filtered: dissolved organic carbon (DOC) and particulate organic carbon (POC) and unfiltered: total organic carbon (TOC). Sites not sampled for POCPON (particulate organic nitrogen). Only stations with the full set of nitrogen and phosphorus data were used in the multivariate analysis D.
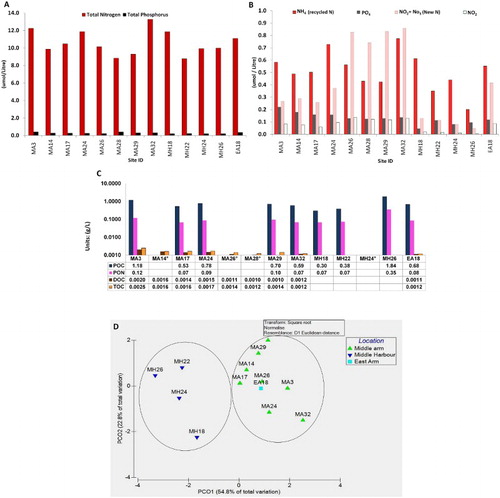
Figure 5. A, Picoplankton and phytoplankton cell counts expressed as percentage versus sites sampled. The triangle (Δ) indicates high density of particulates in the sample, obscuring phytoplankton. B, A principle component analysis for the picoplankton community distribution in PRIMER.
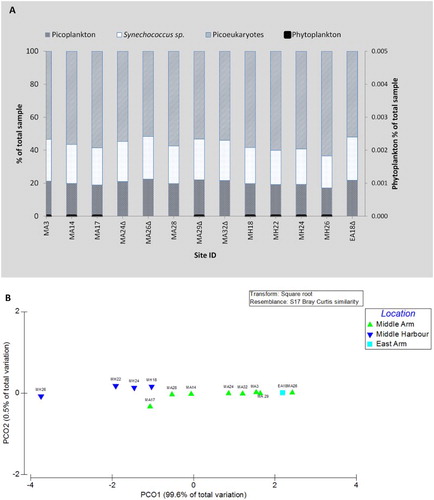
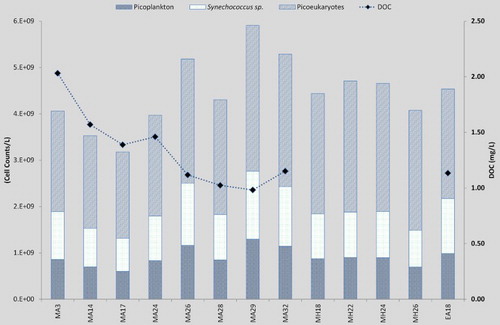
Figure 6. Picoplankton community cell counts for each site subdivided into three groups: picoplankton; Synechococcus sp.; and picoeukaryotes, with dissolved organic carbon (DOC) on the secondary axis.