Figures & data
Table 1. Collection data for the Ranunculus acris samples.
Table 2. Name and GenBank® accession numbers of psbJ-petA and trnK sequences and haplotype labels for their combinations.
Table 3. Concatenated alignments of variable sites in the two chloroplast regions of Ranunculus acris.
Figure 1. Visualisation of haplotype frequencies in New Zealand and overseas. Numbers in parentheses represent sample sizes. The sizes of the pie charts are visual guides for sample sizes and are not to scale.
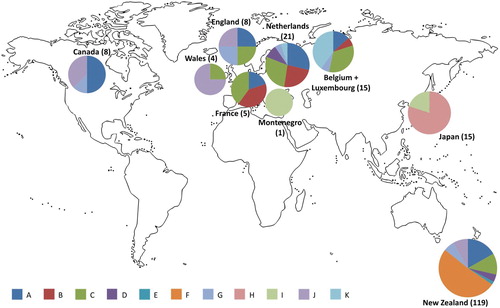
Table 4. Frequencies of the different chloroplast haplotypes from the combined trnK intron and psbJ-petA sequences for Ranunculus acris from New Zealand and overseas.
Figure 2. Majority rule phylogram for concatenated haplotype sequences. Bayesian consensus tree for all Ranunculus acris chloroplast haplotypes (concatenated trnK and psbJ-petA sequences, 1740bp), rooted on the outgroup species R. glabriusculus. Scale bar indicates genetic distance expressed as number of substitutions per site, branch labels show the consensus support (%).
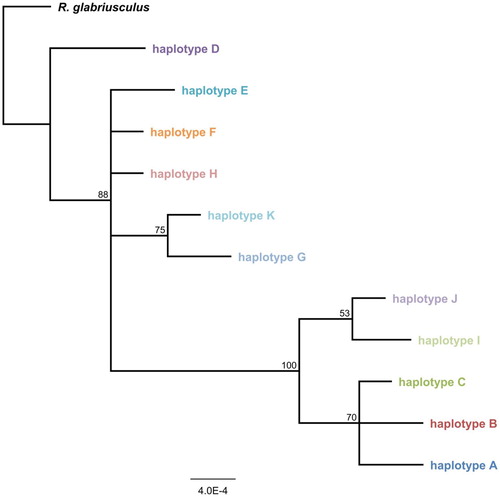
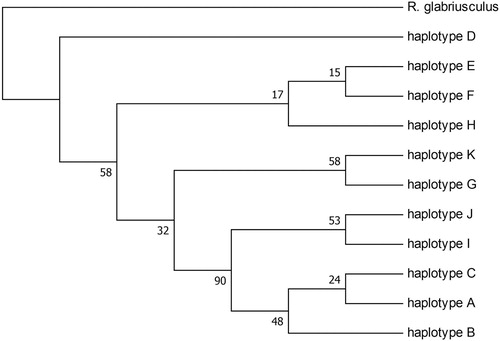
Figure 3. Bootstrap consensus tree for 11 haplotypes and outgroup. The evolutionary history was inferred using the Maximum Parsimony method. Branches corresponding to partitions reproduced in less than 50% bootstrap replicates are collapsed. The percentage of replicate trees in which the associated taxa clustered together in the bootstrap test (500 replicates) are shown next to the branches. The analysis involved 12 nucleotide sequences. There were a total of 1740 positions in the final dataset.