Figures & data
Figure 1. Hypothetical biosynthetic pathway for the production of Group I, II, and III diterpenes by Dictyota and Canistrocarpus (Teixeira and Kelecom Citation1988, Citation1989; Teixeira Citation2010).
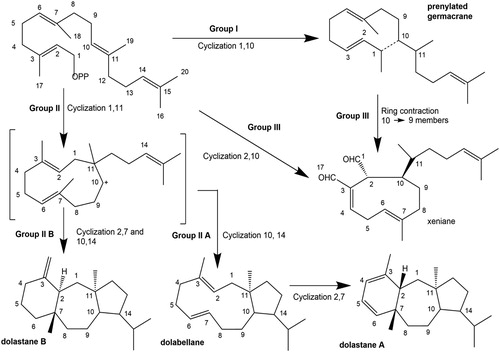
Table 1. Chemotaxonomic groups of diterpenes produced by Canistrocarpus and Dictyota species from Brazila.
Figure 2. Dictyota ciliolata. A, Voucher specimen from Rocas Atoll (HRJ 5516) (scale bar = 10 cm). B, Detailed view of the same specimen showing margins with conspicuous teeth (scale bar = 1 cm). C, Voucher specimen from Preta beach (HUNI 5776) (scale bar = 5 cm). Insert: detailed view of the discoid holdfast (scale bar = 5 mm). D, Detailed view of the same specimen showing margins with very small teeth (black arrows) (scale bar = 1 cm). E, Voucher specimen from Prainha (HUNI 5010) (scale bar = 2 cm). F, Detailed view of the same specimen showing smoothed margins (scale bar = 5 mm). G, Voucher specimen from Prainha (HUNI 5011) (scale bar = 5 cm). H, Detailed view of the same specimen showing sparsely cilio-dentate margins (black arrows) (scale bar = 2 cm).
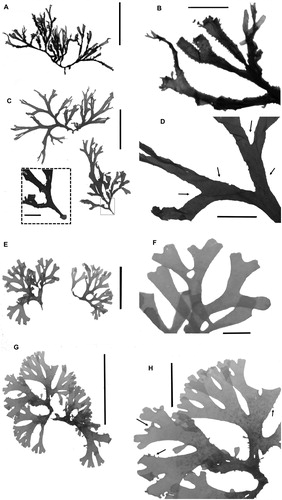
Figure 3. Diterpenes produced by the three populations of D. ciliolata.
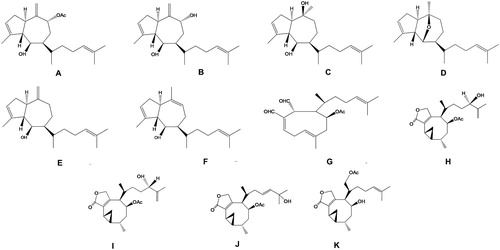
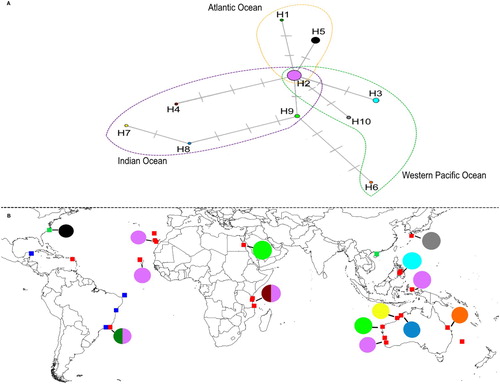
Figure 4. Haplotype diversity of psbA sequences taken from D. ciliolata populations. A, Haplotype network of psbA showing the three geographically segregated groups; the haplotype shown in the intersection is the only haplotype found in all three regions. B, Distribution of the 10 haplotypes in the Atlantic and the Indo-West Pacific populations. Squares indicate locations where D. ciliolata had previously been studied. Red squares: DNA sequences available for a given population; blue squares: known diterpenes from a given population; green squares: DNA sequences and known diterpenes available for a given population. Map based on data from Cronin et al. (Citation1995); Cronin and Hay (Citation1996); De Clerck et al. (Citation2006); Tronholm et al. (Citation2010, Citation2012, Citation2013); Caamal-Fuentes et al. (Citation2014b); Cheng et al. (Citation2014); and the present study.