
Figures & data
Figure 1. A, left, c. 1200 New Zealand forest cover pre-human settlement; middle, c. 1840 post-Māori burning and pre-European settlement; right, c. 1990 post-European settlement (from Weeks et al. Citation2012). B, Threatened Environment Classification (from Cieraad et al. Citation2015). C, Dryland zone shown in orange (from McGlone et al. Citation2017; modified from Walker et al. Citation2009). D, Ten environmental domains (from Overton and Leathwick Citation2001).
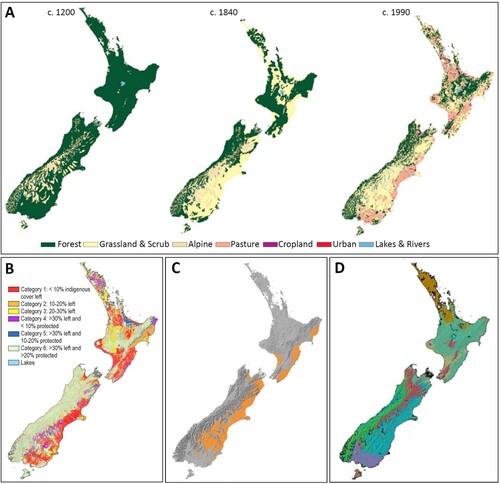
Figure 2. Major regions (and their boundaries) identified as potential areas for ecosourcing. A, Phylogeographic regions where two or more species share similar genetic patterns in having a boundary between genotypes (numbers indicate genotypes represented by a general boundary). Lines marking phylogeographic patterns from studies listed in Supplementary Table S3 and shown individually in Supplementary Figure S2. Note the shaded areas represent 4 and 5 species each, respectively, and are therefore generalised boundaries. Other species have negligible or clinal patterns of variation (indicated by left-hand bars). B, Biogeographic regions. The shaded area represents an area where competing hypotheses of the biogeographic boundary occur (see text). Hatched line represents Southern Alps axis. C, Eight environmental domains.
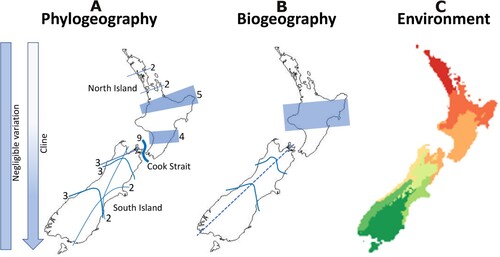
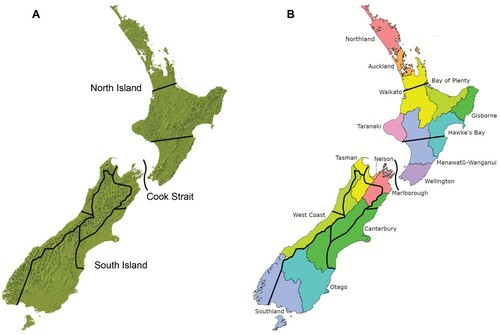
Figure 3. Nine proposed eco-evolutionary regions for ecosourcing. A, Ecosourcing regions overlaid onto New Zealand topographic map. B, Ecosourcing regions overlaid onto Regional Council regions.