668
Views
3
CrossRef citations to date
0
Altmetric
Original Articles

Sediment macrobenthos off eastern Waiheke Island, Hauraki Gulf, New Zealand

&
Pages 149-165 | Received 14 Jan 2010, Published online: 06 Sep 2010

Figures & data

Fig. 1 Site distribution and associated substratum type [hatched area depicts Tawera+Purpurocardia formation of Powell (Citation1937)]; insets: North Island, New Zealand; and Waiheke Island, Hauraki Gulf.

Fig. 1  Site distribution and associated substratum type [hatched area depicts Tawera+Purpurocardia formation of Powell (Citation1937)]; insets: North Island, New Zealand; and Waiheke Island, Hauraki Gulf.

Fig. 2 Dry weight composition of sediment grain size class each of the three substrata (mud, mud/gravel and gravel).
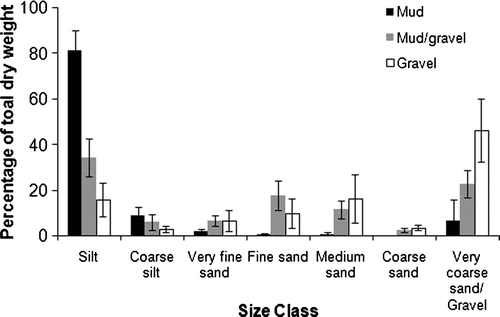
Fig. 2  Dry weight composition of sediment grain size class each of the three substrata (mud, mud/gravel and gravel).

Table 1  Classification of relative density and richness using a 7-point scale for all subtidal substratum types, eastern Waiheke Island.

Table 2  Number of individuals and taxa per sample (0.0336 m2) in each substratum type.

Fig. 3 Species accumulation curves, all substrata.

Fig. 3  Species accumulation curves, all substrata.

Fig. 4 The relationship between species dominance and richness, all substrata, eastern Waiheke Island.
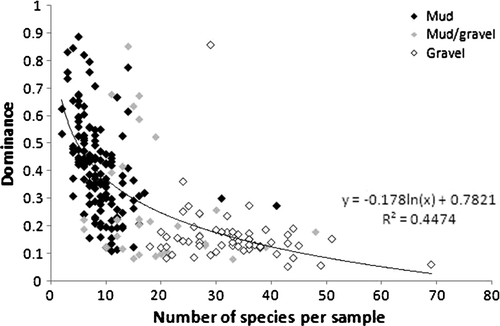
Fig. 4  The relationship between species dominance and richness, all substrata, eastern Waiheke Island.

Table 3  Sediment grain size analyses by substratum type.

Fig. 5 Multi-dimensional scaling plot of species assemblages within three substrata.

Fig. 5  Multi-dimensional scaling plot of species assemblages within three substrata.

Table 4  DIVERSE indices by substratum type and depth (mean±SD), square-root transformed data.

Table 5  Breakdown of average similarity in taxon richness by substratum, to Phylum, square-root transformed data.

Table 6  Breakdown of average similarity in taxon abundance by substratum to level of Class, and Phylum Nemertea (average similarity of samples in parentheses).

Table 7  SIMPER results for muds,average similarity: 39.09, square-root transformed data.

Table 8  SIMPER results for mud/gravels, average similarity: 22.09, square-root transformed data.

Table 9  SIMPER results for gravels, average similarity: 38.16, square-root transformed data.

Fig. 6 Multi-dimensional scaling plot of species assemblages within muds, grouped by depth (<10, 10–15, >15 m).
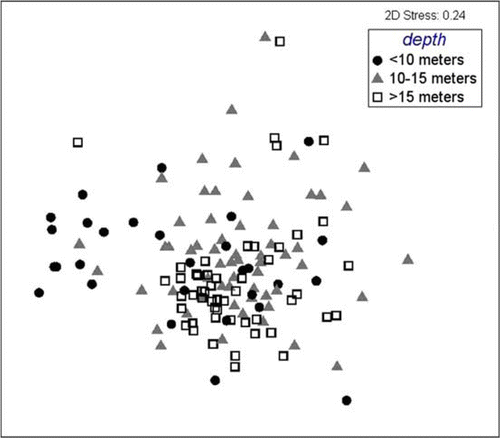
Fig. 6  Multi-dimensional scaling plot of species assemblages within muds, grouped by depth (<10, 10–15, >15 m).

Fig. 7 Multi-dimensional scaling plot of species assemblages within mud/gravels, grouped by depth (<10, 10–15, >15 m).
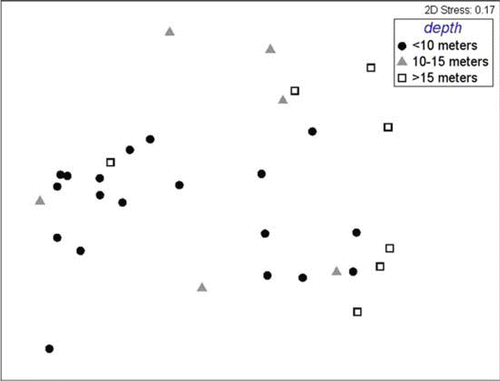
Fig. 7  Multi-dimensional scaling plot of species assemblages within mud/gravels, grouped by depth (<10, 10–15, >15 m).

Fig. 8 Multi-dimensional scaling plot of species assemblages within gravels, grouped by depth (<10, 10–15 m).
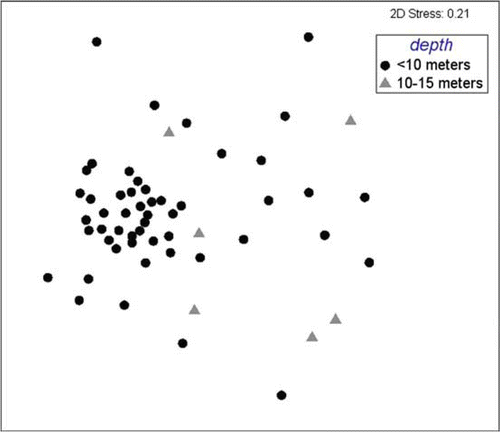
Fig. 8  Multi-dimensional scaling plot of species assemblages within gravels, grouped by depth (<10, 10–15 m).

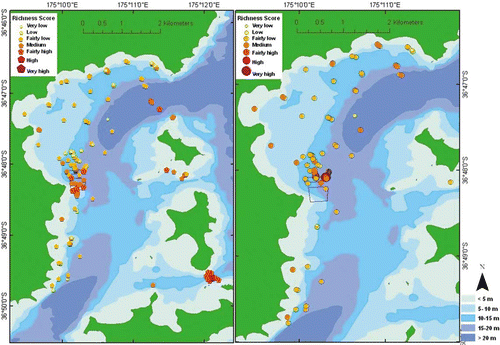
Fig. 9 Spatial distribution of relative species richness, all substrata (left), muds (right).

Fig. 9  Spatial distribution of relative species richness, all substrata (left), muds (right).

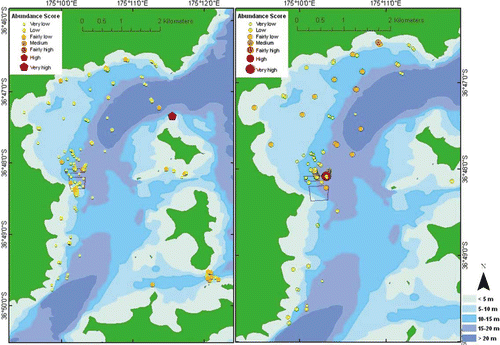
Fig. 10 Spatial distribution of relative species density, all substrata (left), muds (right).

Fig. 10  Spatial distribution of relative species density, all substrata (left), muds (right).

Fig. 11 Dendrogram of similarity in faunal composition of all sites (n=228), all substratum types, eastern Waiheke Island, using presence/absence data.
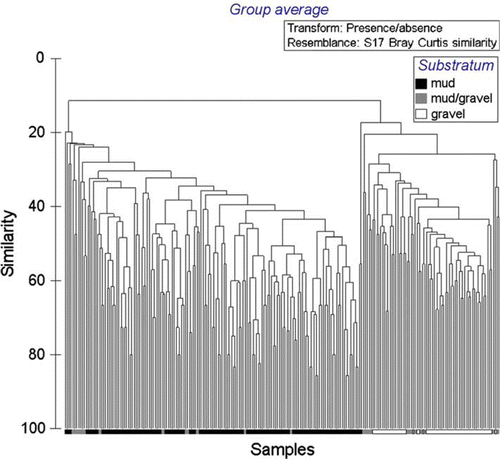
Fig. 11  Dendrogram of similarity in faunal composition of all sites (n=228), all substratum types, eastern Waiheke Island, using presence/absence data.

Fig. 12 Dendrogram of similarity in molluscan and echinoderm taxa (n=228), all sites, all substratum types, eastern Waiheke Island, using presence/absence data.
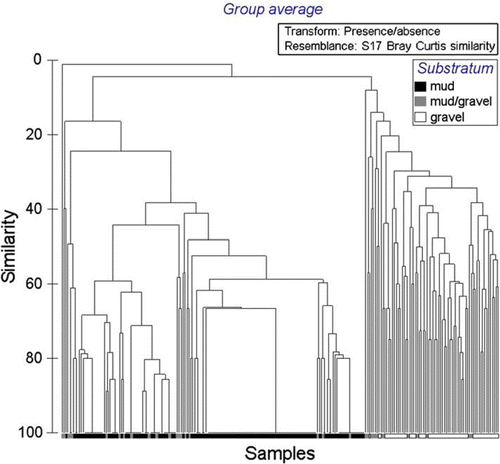
Fig. 12  Dendrogram of similarity in molluscan and echinoderm taxa (n=228), all sites, all substratum types, eastern Waiheke Island, using presence/absence data.

Fig. 13 Dendrogram of similarity in faunal composition of all sites, muddy substrata (n=139), eastern Waiheke Island, using presence/absence data.
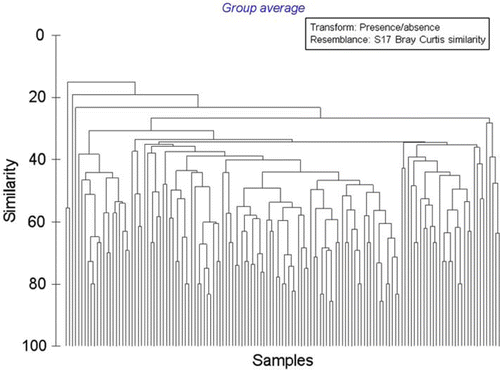
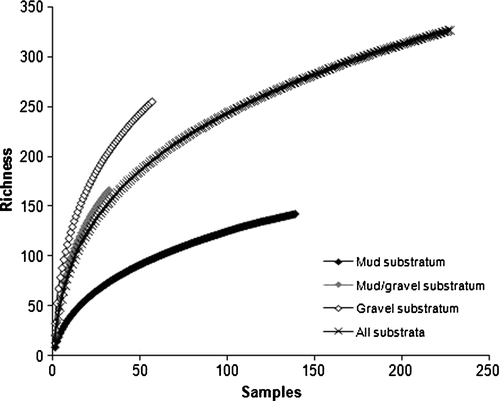
Fig. 13  Dendrogram of similarity in faunal composition of all sites, muddy substrata (n=139), eastern Waiheke Island, using presence/absence data.
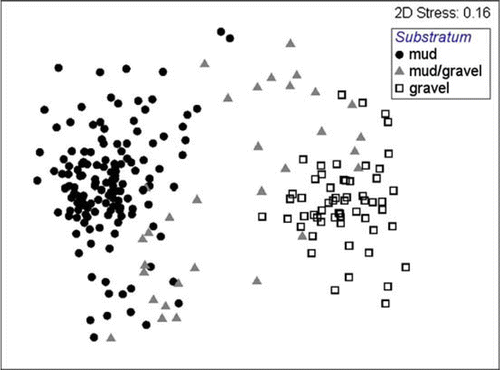
Table 10  Nomenclature of taxa reported by Powell (1937) and this study.

Reprints and Corporate Permissions

Please note: Selecting permissions does not provide access to the full text of the article, please see our help page How do I view content?

To request a reprint or corporate permissions for this article, please click on the relevant link below:

Academic Permissions

Please note: Selecting permissions does not provide access to the full text of the article, please see our help page How do I view content?

Obtain permissions instantly via Rightslink by clicking on the button below:

If you are unable to obtain permissions via Rightslink, please complete and submit this Permissions form. For more information, please visit our Permissions help page.