Figures & data
Figure 1 Location of river outwelling plumes and major aquaculture development areas along the New Zealand coastline.
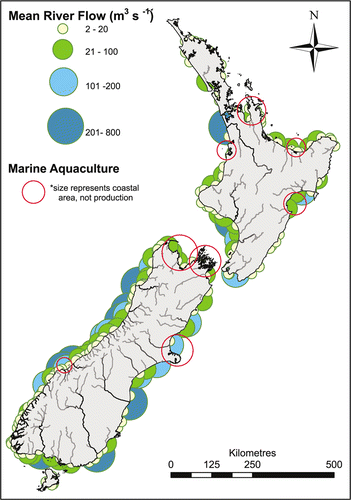
Figure 2 Sampling locations and aquaculture management areas in Tasman Bay. Site designations refer to geographic locations and mean water depth. Stippled polygons represent aquaculture management areas.
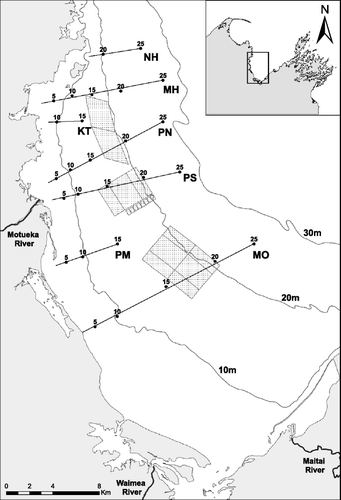
Figure 3 River margin sediment sampling locations (squares = main stem of the Motueka River, dots = tributaries) and suspended sediment sampling locations (triangles); u/s refers to upstream.
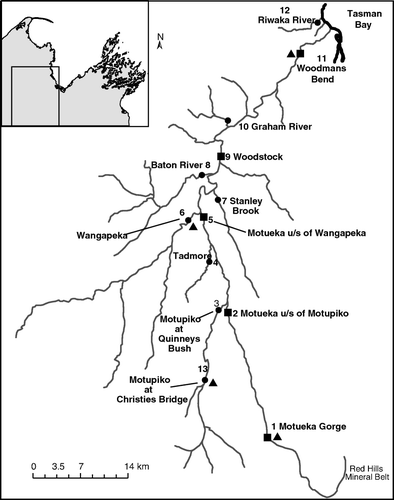
Figure 4 Monthly suspended sediment load at four sites in the Motueka catchment. See for site locations.
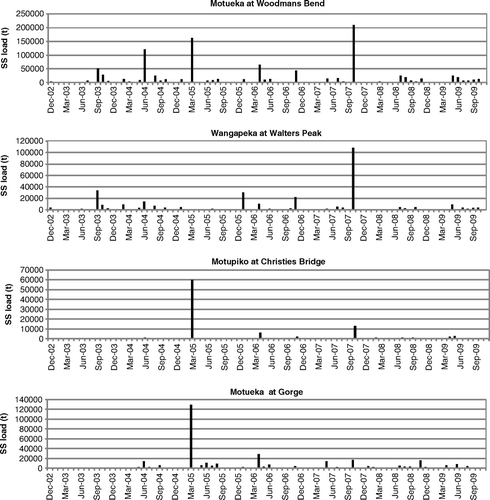
Table 1 Specific sediment yield and sediment load estimates for four sampling sites in the Motueka catchment.
Figure 5 Particle size, gravel (>2 mm), sand (2–0.063 mm) and muds/fines (<0.063 mm), of Tasman Bay sediments.
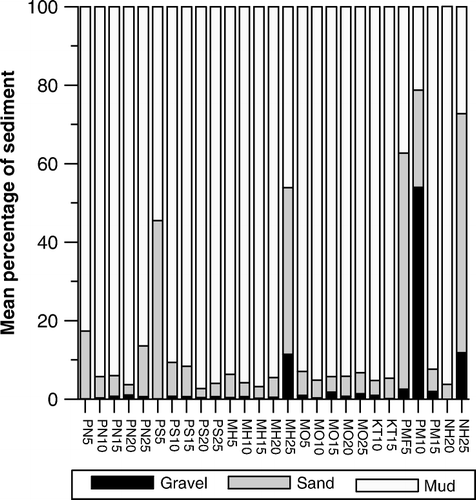
Figure 6 Organic matter content (% ash free dry weight) in Tasman Bay sediments. Crosses refer to sampling sites.
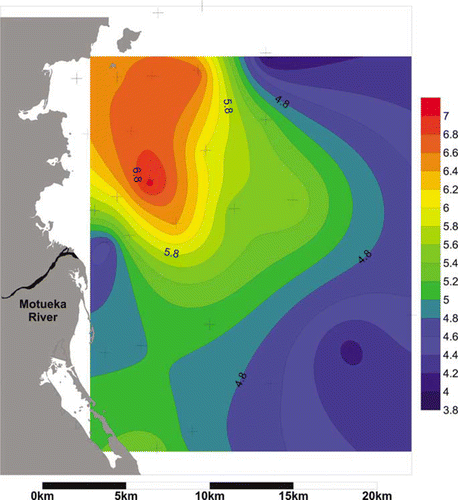
Figure 7 Ni and Cr concentrations in river margin sediments from stations along the main stem Motueka River (grey bars) and tributaries (white bars). ISQG refers to interim sediment quality guidelines. See for site locations 1–12.
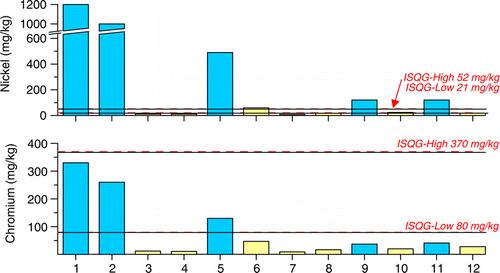
Figure 8 Spatial patterns of: A, nickel; B, chromium; C, copper; D, barium; E, vanadium; F, aluminium; G, lead; H, strontium concentrations (mg/kg) in Tasman Bay sediments. Crosses refer to positions of sampling sites.
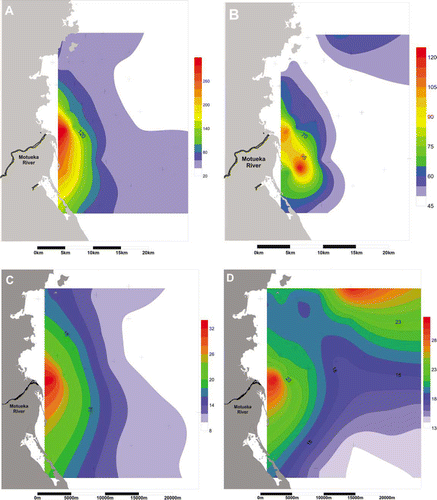
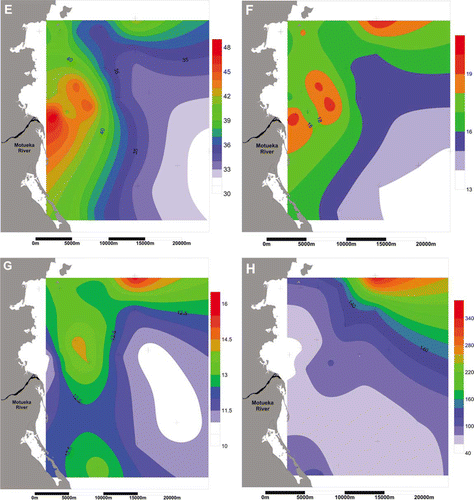
Figure 9 Spatial variation in: A, taxa richness; B, Shannon–Weiner diversity values; C, total abundance; and D, abundance of Heteromastus filiformis (grey bars) and Theora lubrica (white bars). Data are averages + standard error (n=5 cores).
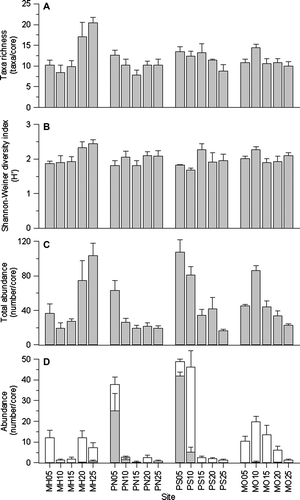
Figure 10 Multi-dimensional scaling (MDS) ordination showing: A, similarity of sites based on their infaunal taxa composition (2D stress = 0.18, sites circled were ≥59% similar), and B–D, bubble plots indicating relative values for the most correlated (Spearman ρ-values) explanatory variables.
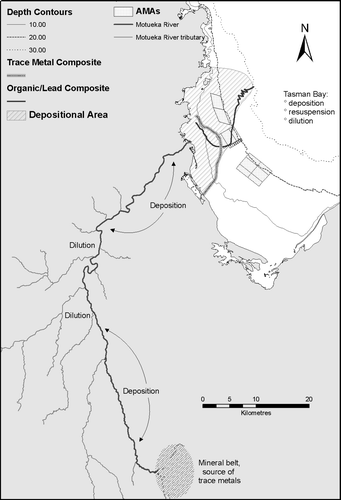
Figure 11 Depositional footprint of the Motueka River plume in Tasman Bay, based on trace metal and organic matter/Pb composites, and the mechanism of delivery of Ni- and Cr-enriched sediments from the upper catchment. The mineral belt region is not drawn to scale.