Figures & data
Fig. 1 A, Ramp profile, and B, cross-section (all dimensions are in mm), showing the experimental set-up used to test passage success of juvenile īnanga. Artificial grass was added to the ramp surface (C) used in testing juvenile īnanga passage success to provide a rough surface allowing fish to rest during their upstream ascent without getting washed back into the lower holding bin, and D, a pool (arrow) was created at 1.5 m to provide further resting opportunities for fish. E, An īnanga juvenile on the wetted margin of the ramp. In general, fish burst swam up the ramp for approximately 1 m, before they moved to the wetted margin of the ramp in our juvenile īnanga passage success tests.
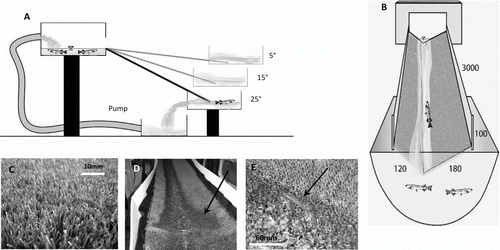
Fig. 2 A, Mean (±SE) velocity measured at 5°, 15° and 25° slope on the ramp (○) and in pools (•) in the experiments. B, Proportion (%) of juvenile īnanga passing the ramp at 5°, 15° and 25° angles with one pool.
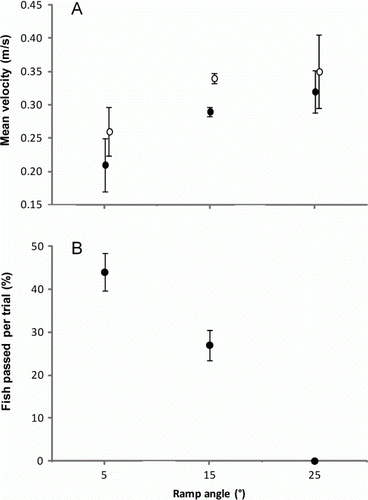
Table 1 The five treatment combinations tested in the ramp experiment evaluating juvenile īnanga passage success including three different angles with varying pool combinations
Fig. 3 Predicted passing sizes of juvenile īnanga at 5° (—) and 15° (····) ramp angles with no pool determined by a logistic mixed-effects model.
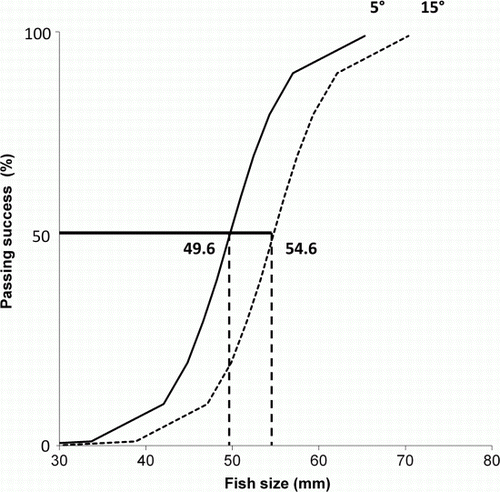
Table 2 Generalised mixed-effects models testing of the fixed main and interactive effects of (a) ramp angle (5°, 15°, 25°, one pool) and fish size on the success or failure of fish to climb the ramp, and (b) ramp angle (5° and 15°) and pool presence (no pool or one pool) on the success of failure of fish to climb the ramp, while accounting for variation because of the sampling day
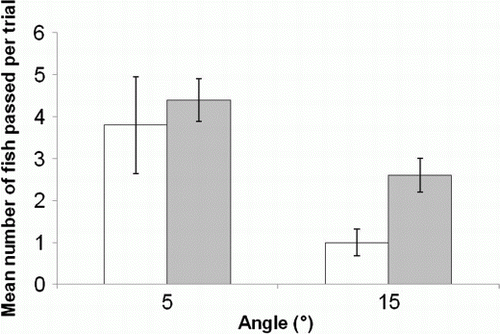
Fig. 4 Mean (±SE) number of juvenile īnanga that passed the ramp at 5° and 15° with zero pools (□) or one pool (▪).