Figures & data
Figure 1 Location maps. A, Pāuatahanui Inlet, showing sub-estuaries. (Base map: MapToaster Topo, software by Integrated Mapping, © MetaMedia Ltd.) B, Catchment, showing sub-catchments. (Base map: TUMONZ, Vision Software for Management & Technology Systems Ltd.) C, Pāuatahanui Inlet, North Island of New Zealand. (Base map: TUMONZ, Vision Software for Management & Technology Systems Ltd.)
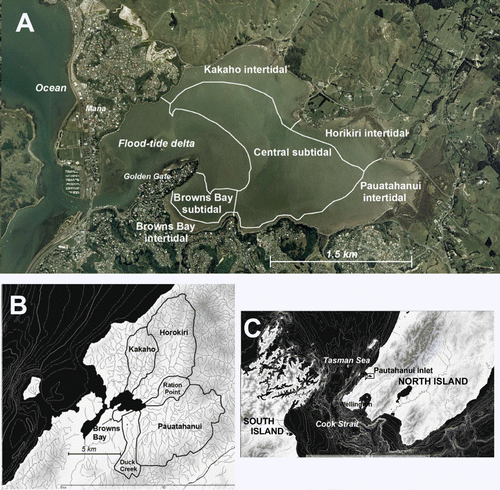
Figure 2 Analysis of sediment load limits for the case of two sources of sediment depositing in one sink. Sediment load limits chosen from the region denoted by ‘Valid sediment load limits’ will fail neither target and will be achievable by mitigation.
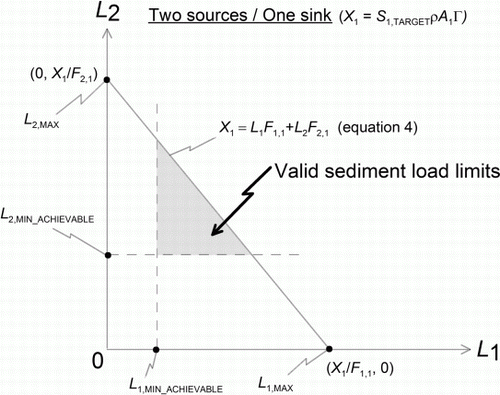
Figure 3 Analysis of sediment load limits for the case of three sources of sediment depositing in one sink. Sediment load limits chosen from the region denoted by ‘Valid sediment load limits’ will fail no target and will be achievable by mitigation.
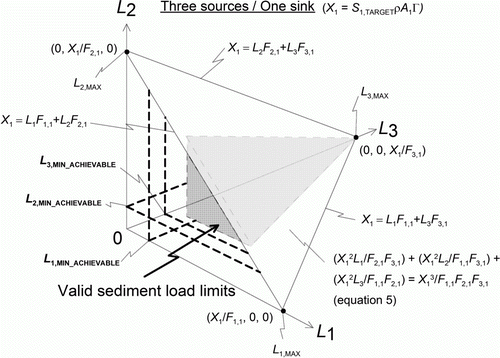
Figure 4 Analysis of sediment load limits for the case of two sources of sediment depositing in two sinks. Sediment load limits chosen from the region denoted by ‘Valid sediment load limits’ will fail no target and will be achievable by mitigation.
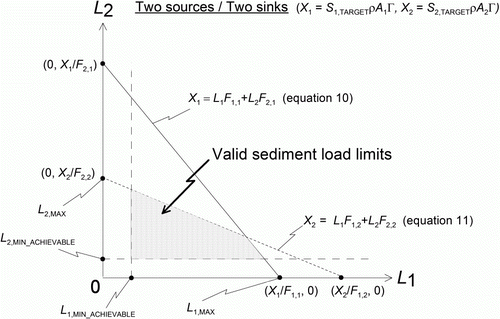
Table 1 The constituent-particle fate matrix (F c,e,p ), which was specified.
Table 2 Catchment Landuse for Environmental Sustainability (CLUES) predictions of the annual-average total (sum of all grain sizes) sediment run-off at the base of each sub-catchment under the present-day land use, and partitioning of the total sediment run-off between the two sediment size fractions.
Table 3 Sub-estuary total area and area over which catchment-sourced sediment was allowed to deposit in each sub-estuary.
Table 4 Predicted and observed total (sum of all particle sizes) and constituent–particle (total multiplied by bed-sediment composition) annual-average sedimentation rates (mm/year).
Table 5 The total-sediment fate matrix (F c,e ), calculated from the constituent-particle fate matrix and sub-catchment sediment run-off (Equation Equation22).
Table 6 The total-sediment source matrix (O c,e ), calculated from the fate matrix and sub-catchment sediment run-off (Equation Equation23).
Figure 5 Analysis of capacity sacrifice for the case of two sources of sediment depositing in two sinks.
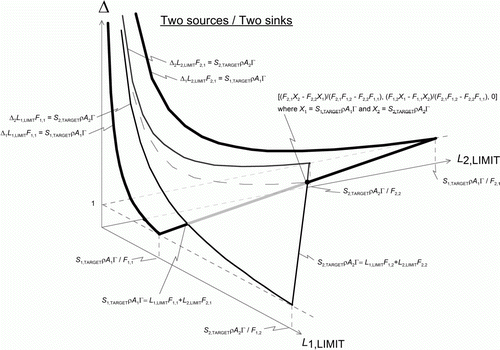
Figure 6 Equation (Equation8) expanded and rearranged to apply to Pāuatahanui Inlet, plotted for a range of values of Φ for each sub-estuary, where S e,TARGET=ΦS e,PRESENT. Sediment run-off is normalised by present-day sediment run-off. The figure guides the discovery of sediment load limits for Pāuatahanui Inlet. Refer to the text for details.
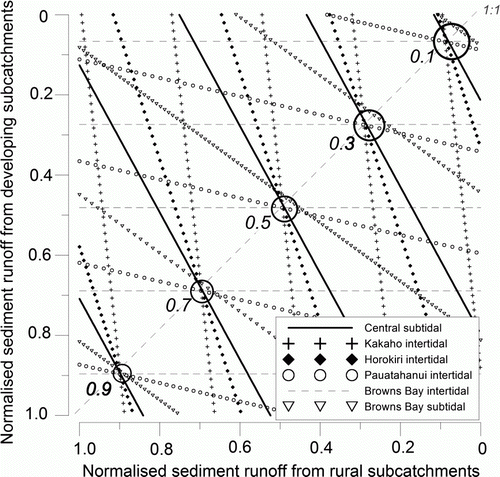
Figure 7
Example case in which the target is a 30% reduction in sedimentation in all sub-estuaries. A,Valid (will not fail any sedimentation targets) and invalid (will fail at least one sedimentation target) sediment load limits. B, Average capacity sacrifice as a function of sediment run-off from the rural and developing sub-catchments.
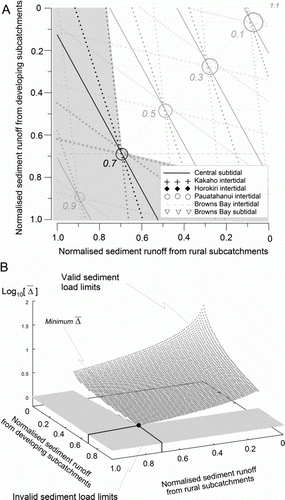
Figure 8
Example case in which the targets are 10% reduction in sedimentation on the Kakaho intertidal flats; 50% reduction in sedimentation on the Pāuatahanui intertidal flats and in Browns Bay subtidal; and 30% reduction in sedimentation in the three remaining sub-estuaries. A, Valid (will not fail any sedimentation targets) and invalid (will fail at least one sedimentation target) sediment load limits. B, Average capacity sacrifice as a function of sediment run-off from the rural and developing sub-catchments.
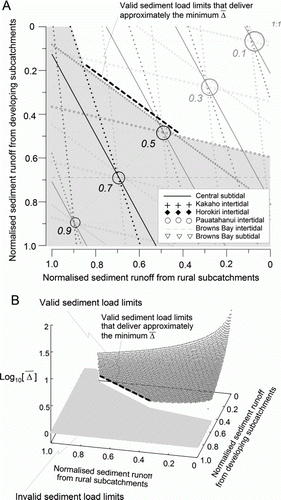
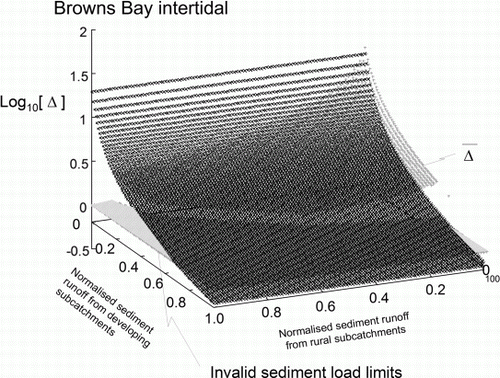
Figure 9
Capacity sacrifice Δ
e
for an individual target of 30% reduction in sedimentation rate in the Browns Bay intertidal flats. Δ
e
is plotted for invalid and valid sediment load limits, where Δ
e
<1 signifies that the individual target sedimentation rate will fail to be achieved. Also shown is for the case where the goal is to achieve simultaneous targets of 10% reduction in sedimentation on the Kakaho intertidal flats; 50% reduction in sedimentation on the Pāuatahanui intertidal flats and in Browns Bay subtidal; and 30% reduction in sedimentation in the three remaining sub-estuaries.
Table