Figures & data
Table 1 Locations and characteristics of the three study sites on the Cust, Selwyn and Waipara Rivers, Canterbury, New Zealand.
Table 2 Categories of periphyton distinguished in the visual assessments.
Figure 1 Summary of measurements made by three observers at three rivers sites on three occasions. A, Estimates of mean periphyton cover in seven visual categories with each observer viewing 40 different points. B, Mean chlorophyll a determined from quantitative samples collected from the same 40 points viewed in A. C, Mean chlorophyll a derived from visual assessments of percentage cover weighted by a conversion factor (see text for details). D, Mean size of rocks sampled for chlorophyll a, as surface area estimated from x, y and z dimensions.
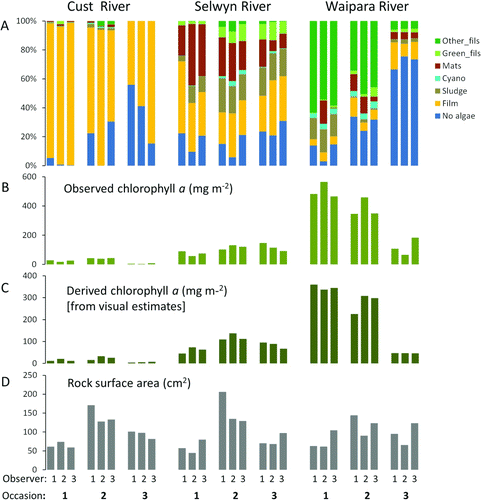
Table 3 Summary results (P-values) of 3-way ANOVAs to determine differences in estimates of % cover of seven visual categories of periphyton, across observers, survey occasions and sites, and showing interactions between observers and survey occasions and sites. (a) Data from a 120-point dataset (all observers viewed the same locations); (b) data from a 40-point dataset (observers all viewed different locations). Data were mean percentage cover estimates along transects of 10 views. Significant differences are in bold type.
Figure 2 Cover by mats at the Selwyn River site in June 2011 (visit 2) assessed independently by three observers at 120 pre-determined viewing locations. Each box plot is derived from 100 random selections (with replacement) of 2, 4, 6, etc. observations (views).
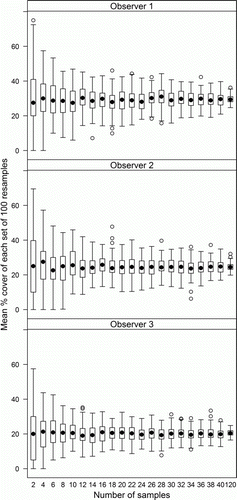
Figure 3 Minimum numbers of views required to achieve 95% confidence of being within 10% of the true mean, calculated for every survey combination and visual assessment category using bootstrap resampling on the 120 views assessed by each observer in each survey.
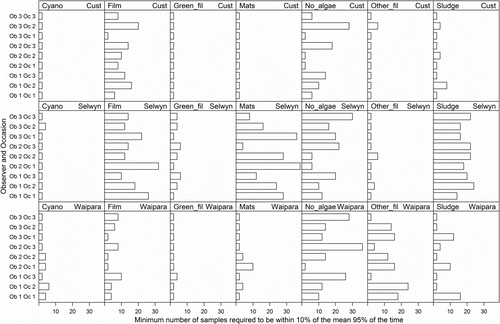
Figure 4 Proportion of the means of 100 randomly re-sampled sets of observations of chlorophyll a (for each site, occasions and observer combination), which were within 20% of the mean of all 120 observations. Numbers of samples in each resampled set ranged from two to 40. Each row shows the results from one observer.
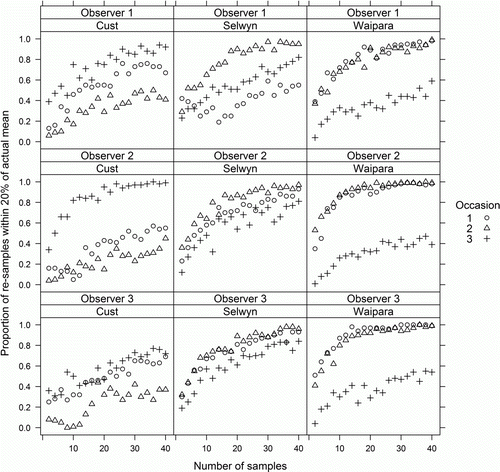
Figure 5 Proportion of the means of 100 randomly resampled sets of observations of chlorophyll a (with data from three observers combined), which were greater than 15, 50, 120 and 200 mg m−2 (bottom row to top row). Numbers of samples in each resampled set ranged from two to 40.
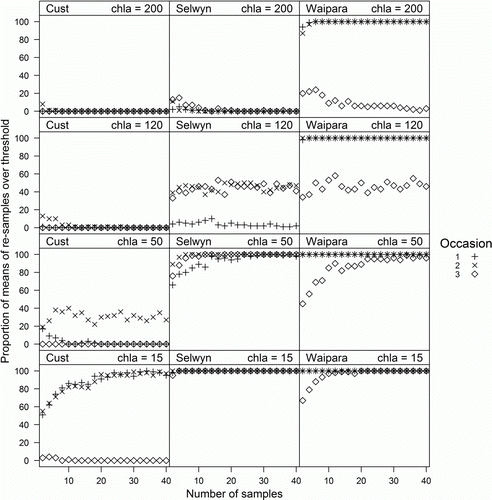
Table 4 Summary results (P-values) of 3-way ANOVAs to determine differences in observed and derived chlorophyll a across observers, survey occasions and sites. Chlorophyll a was estimated from the visual assessments using conversion factors determined from cover on individual rocks (see ). Significant differences are in bold type.
Figure 6 Chlorophyll a derived from visual estimates made by three observers at three sites on three occasions, using the conversion factors in , plotted against measured chlorophyll a. Each point is the mean of chlorophyll a samples and visual assessments at 20 points. The solid line indicates the best fit regression (R2=0.889, P<0.001) and the dashed line is the 1:1 relationship.
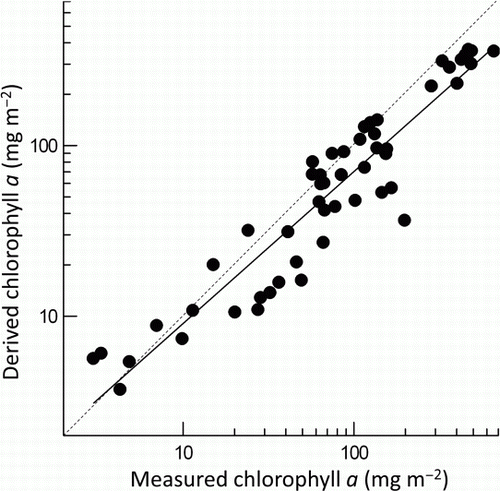
Table 5 Chlorophyll a equivalents for the seven periphyton categories, determined from measurements of chlorophyll a from samples with 100% cover by each category.
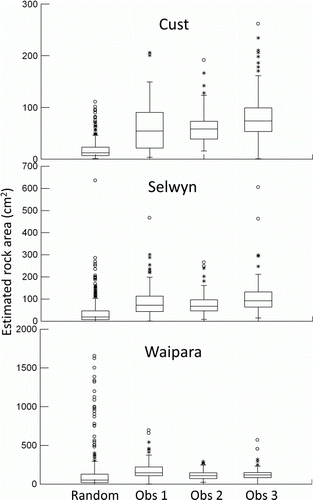
Table 6 Summary results (P-values) of pairwise comparisons (following significant ANOVAs) of mean rock size in collections made by three observers (obs 1, 2 and 3) for chlorophyll a samples, and by a fourth person as a separate random collection (random). Significant differences are in bold type.
Figure 7 Distributions of rock sizes (as estimated exposed surface area calculated from x, y and z dimensions) collected at the Cust, Selwyn and Waipara River survey sites by three observers for sample collection for chlorophyll a, plus a random collection made by a fourth person. Total n=120 for observers 1, 2 and 3, and n = 360 for the random collection, pooled from three survey occasions.