Figures & data
Table 1 An example showing how a substrate size score was calculated for each grid square.
Table 2 Summary information for 120 native freshwater fish that were implanted with 12.5-mm passive integrated transponder (PIT) tags in the Mangaore Stream, New Zealand in 2008.
Table 3 Numbers of passive integrated transponder (PIT)-tagged fish that were detected in a 100-m reach of the Mangaore Stream, Manawatu, New Zealand before and after two floods in 2008.
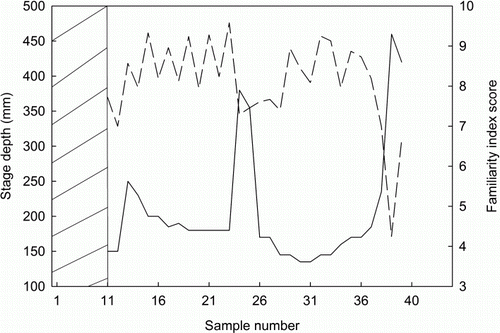
Figure 1 Plots showing correlation between stage depth at each sampling occasion (solid line) and community familiarity score (dashed line). Scores were calculated for each sampling occasion based on the number of times each individual fish was found during the previous 10 sampling occasions. 0 = highly unfamiliar; 10 = highly familiar. Shaded area represents the first 10 sampling occasions, for which familiarity was not calculated. Samples 24 and 25 occurred during the April flood and samples 39 and 40 during the July flood.