Figures & data
Table 1 Estimated parameters of length–weight relationships for 53 freshwater fish species in New Zealand using wet-weight data (except for Stokellia anisodon which were preserved in formalin). Parameters are given for power equations and 95% CI for a are provided in Table S1. Quadratic parameters are supplied in Table S2 if they were selected as the better model. For the ‘Origin’ column: N = native, I = introduced, M = marine wanderer, E = extinct. NA = not available.
Table 2 Estimated parameters of length–weight power relationships for New Zealand freshwater fish species for which dry-weight data was available. Quadratic parameters are supplied in Table S3 if they were selected as the better model.
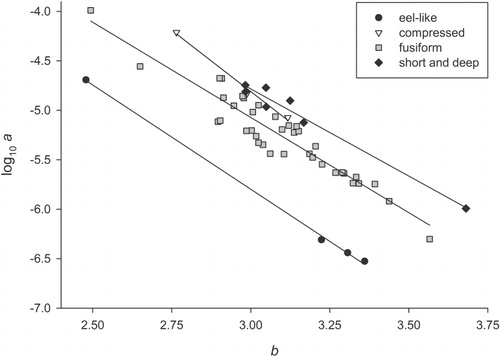
Table 3 Differences in length–weight relationships between locations. Equations are only provided for those species where a significant difference between the North and South Islands was detected (the list of species for which no significant differences were detected are in Table S4).
Table 4 Differences in length–weight relationships for male and female fishes. Equations are only provided for those species where a significant difference between the sexes was detected. Note that values for a and b may be markedly different to those in because less data was used across a more limited size range.
Supplemental material