654
Views
6
CrossRef citations to date
0
Altmetric
Research articles

Revisiting Squires' Coral Coppice, Campbell Plateau, New Zealand

, , &
Pages 507-523 | Received 06 Aug 2013, Accepted 12 Dec 2013, Published online: 08 Sep 2014

Figures & data

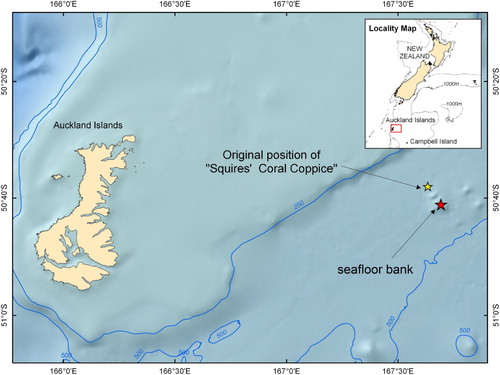
Figure 1 Locality map showing the original position of ‘Squires’ Coral Coppice’ (1965) and the position of the seafloor bank that was the target of the 2011 multibeam survey. The bathymetry shown is from the digital elevation model generated to identify likely targets for the coppice. Bathymetric contours are every 250 m. The map projection is WGS84/Mercator 41 (EPSG: 3994).
Figure 2 TAN1106 3.5 kHz sub-bottom profile with original 1964 trace overlain in pink. Time stamps from the 3.5 kHz profile are shown by the red line. See for location of profile.
Figure 2 TAN1106 3.5 kHz sub-bottom profile with original 1964 trace overlain in pink. Time stamps from the 3.5 kHz profile are shown by the red line. See Fig. 3 for location of profile.
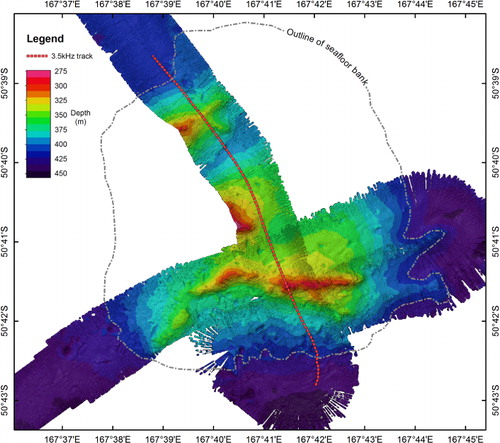
Figure 3 Multibeam map obtained from the 2011 survey, also showing the position of the 3.5 kHz track. The estimated extent of the seafloor bank, based on an examination of the digital elevation model and multibeam bathymetry, is outlined by a black dashed-dotted line. The map projection is WGS84/Mercator 41 (EPSG: 3994).
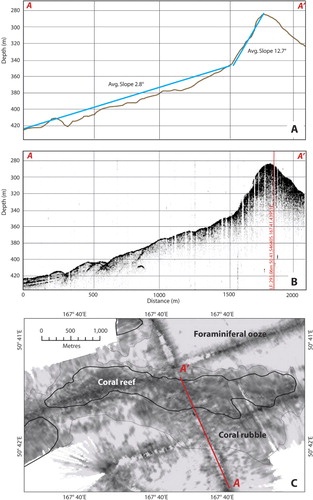
Figure 4 A close up of the ridge-like structure in profile and plan view. A, a close up of the slope change used to delineate the base of the ridge-like structure with the average slope angles shown in blue and calculated (the location of A-A' is shown in ); B, the 3.5 kHz sub-bottom profile also shows a change in the penetration and return signal, with the time stamp shown by the red line (as for ); C, plan view of the backscatter, showing the change in signal between what is interpreted as the background foraminiferal ooze, coral rubble and coral reef. (A-A' is the line shown in and ). High backscatter (reflectivity) values are darker in colour. The map projection for C is WGS84/Mercator 41 (EPSG: 3994).
Figure 4 A close up of the ridge-like structure in profile and plan view. A, a close up of the slope change used to delineate the base of the ridge-like structure with the average slope angles shown in blue and calculated (the location of A-A' is shown in Fig. 4C); B, the 3.5 kHz sub-bottom profile also shows a change in the penetration and return signal, with the time stamp shown by the red line (as for Fig. 2); C, plan view of the backscatter, showing the change in signal between what is interpreted as the background foraminiferal ooze, coral rubble and coral reef. (A-A' is the line shown in Figs. 4A and B). High backscatter (reflectivity) values are darker in colour. The map projection for C is WGS84/Mercator 41 (EPSG: 3994).
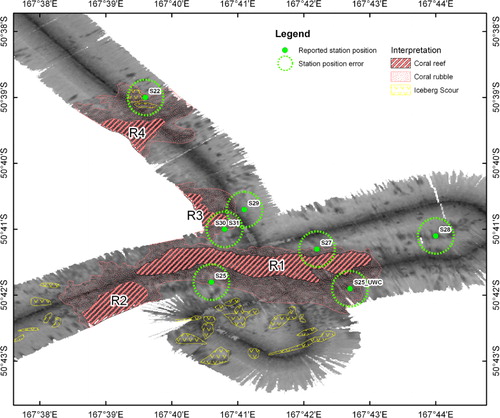
Figure 5 Backscatter and interpretation. R1–R4 are the different ridge-like structures interpreted as coral reefs (R1 is the original ‘Squires’ Coral Coppice'), S22 etc. are the recorded positions of historical samples (taken in 1978) used to ‘ground-truth’ the interpretation. The map projection is WGS84/Mercator 41 (EPSG: 3994).
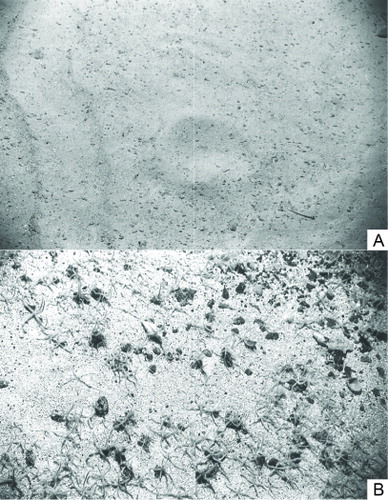
Figure 6 Photographs of the seafloor taken at stations. A, S25_UWC, which shows a soft sediment substratum of foraminiferal ooze; B, S31, which shows a granular substratum and fauna that is indicative of coral rubble habitat.
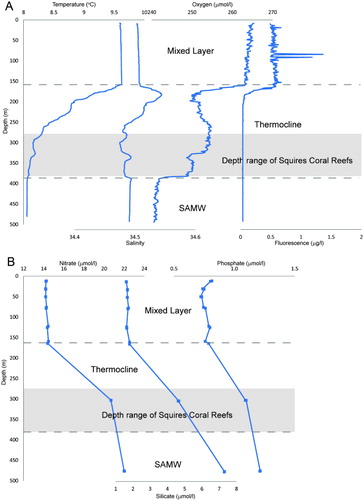
Figure 7 Water column data. A, CTD in situ calibrated measurements of temperature, salinity and oxygen from seabird sensors; B, bottle data measured for nutrients, nitrate, phosphate and silicate. Dashed lines indicate the different water masses–mixed layer in the upper 157 m, and the SAMW (subantarctic mode water) below the thermocline. The shaded area is the depth range where ‘Squires’ Coral Coppice’ was found.
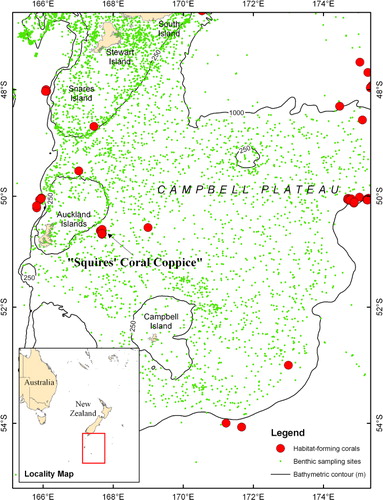
Figure 8 Map of Campbell Plateau showing where habitat-forming corals (Goniocorella dumosa, Solenosmilia variablis, Madrepora oculata, Enallopsammia rostrata; see Tracey et al. Citation2011 for detail) have been recorded (red circles) and benthic sample stations (green dots) where no such corals were found (using sampling gear such as rock dredges, Agassiz trawls, and fish trawls that have successfully recovered corals on the plateau and elsewhere in the New Zealand region). Bathymetric contours are every 250 m. The map projection is WGS84/Mercator 41 (EPSG: 3994).

Appendix 1 List of taxa recorded in dredge samples taken during the 1978 ‘Southern Coral’ survey (cruise # 1080). Taxa were generally identified only to major taxonomic group, and are recorded here at the lowest taxonomic level consistently identified, apart from the scleractinan (stony) corals.

Reprints and Corporate Permissions

Please note: Selecting permissions does not provide access to the full text of the article, please see our help page How do I view content?

To request a reprint or corporate permissions for this article, please click on the relevant link below:

Academic Permissions

Please note: Selecting permissions does not provide access to the full text of the article, please see our help page How do I view content?

Obtain permissions instantly via Rightslink by clicking on the button below:

If you are unable to obtain permissions via Rightslink, please complete and submit this Permissions form. For more information, please visit our Permissions help page.