719
Views
1
CrossRef citations to date
0
Altmetric
Research articles

Life strategists and morpho-functional groups applied to the phytoplankton of a Pampean shallow lake

, , &
Pages 3-19 | Received 01 Oct 2013, Accepted 15 Apr 2014, Published online: 08 Sep 2014

Figures & data

Figure 1 Location of San Miguel del Monte Lake, showing the sampling sites: El Totoral Stream (S1), the deepest zone of San Miguel del Monte Lake (S2) and the gate connection with Las Perdices Lake (S3). The connection with the Salado River is also shown in the lower left-hand corner.
Figure 2 Monthly variations in local rainfall (white bars), water level (solid line) and Secchi disk depth (black circles) at S2. The distance from the water line to the black circles symbol represents the Secchi depths. The period of submerged macrophyte development is represented by the horizontal bar. Exceptional water inflows are also shown.
Figure 3 Annual variation in nitrate plus nitrites (NO3+NO2; µg L−1), soluble reactive phosphorus (SRP; µg L−1), dissolved polyphenols (DPPs; mg L−1), pH, conductivity (µS cm−1) and dissolved oxygen concentration (DO; mg L−1) at the sampling sites.
Figure 4 Temperature profile during the study period at S2 (September: black diamond; October: black square; November: white triangle; December: black ellipse; January: black rectangle; February: black circle; March: white ellipse; April: white rectangle; June: white circle; July: white diamond; August: white square).

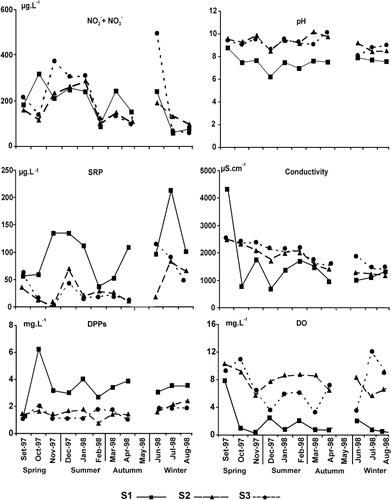
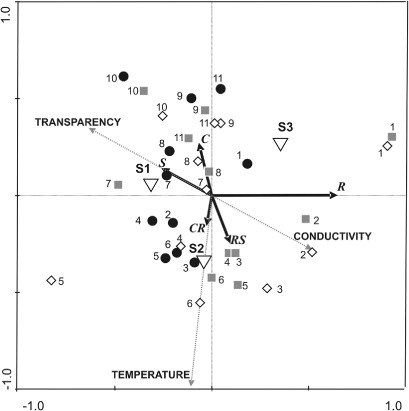
Table 1 Physical, chemical and biological variables at the sampling sites (mean, SD and range).

Figure 5 Variation in total algal density (ind mL−1) and algal biovolume (mm3 L−1) at the three sampling sites during the study period.
Figure 6 Percent of biovolume of the main phytoplankton species at the three sampling sites. The numbers refer to the list of taxa in .
Figure 6 Percent of biovolume of the main phytoplankton species at the three sampling sites. The numbers refer to the list of taxa in Table 2.
Figure 7 C, S and R life strategies of the most representative species of phytoplankton from San Miguel del Monte Lake as a function of morphology (MLD, maximum linear dimension; SA/V, ratio of surface area to volume). The solid lines delimit the zone of each strategy according to Reynolds (Citation1996); the dotted lines are a suggestion. The species' labels refer to the list of taxa in .
Figure 7 C, S and R life strategies of the most representative species of phytoplankton from San Miguel del Monte Lake as a function of morphology (MLD, maximum linear dimension; SA/V, ratio of surface area to volume). The solid lines delimit the zone of each strategy according to Reynolds (Citation1996); the dotted lines are a suggestion. The species' labels refer to the list of taxa in Table 2.

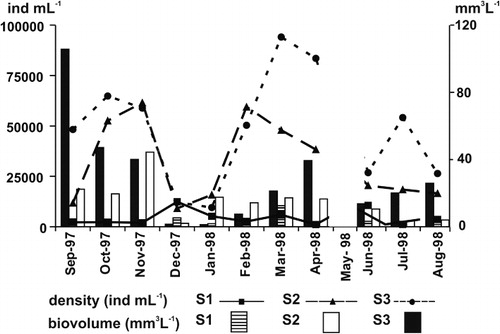
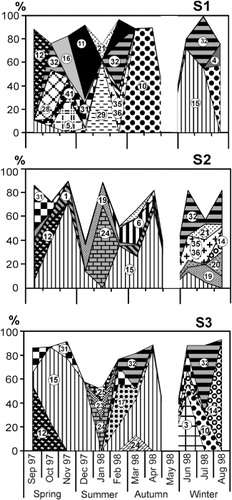
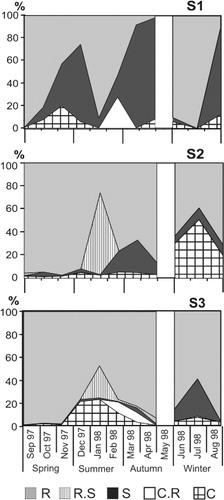
Table 2 Main phytoplankton species of San Miguel del Monte Lake placed into functional groups following Reynolds et al (Citation2002) and Padisák et al. (Citation2009).

Figure 8 Percent biovolume of phytoplankton life strategies at the three sampling sites during the study period.
Figure 9 RDA triplot of environmental variables, algal strategies and samples. Sampling stations in the RDA were used as supplementary variables and are represented by white triangles at the centre of the corresponding spatial distributions. Months are correlatively enumerated. (1 to 11) from September 1997 through August 1998, except May due to flooding of the Salado River.

Reprints and Corporate Permissions

Please note: Selecting permissions does not provide access to the full text of the article, please see our help page How do I view content?

To request a reprint or corporate permissions for this article, please click on the relevant link below:

Academic Permissions

Please note: Selecting permissions does not provide access to the full text of the article, please see our help page How do I view content?

Obtain permissions instantly via Rightslink by clicking on the button below:

If you are unable to obtain permissions via Rightslink, please complete and submit this Permissions form. For more information, please visit our Permissions help page.