Figures & data
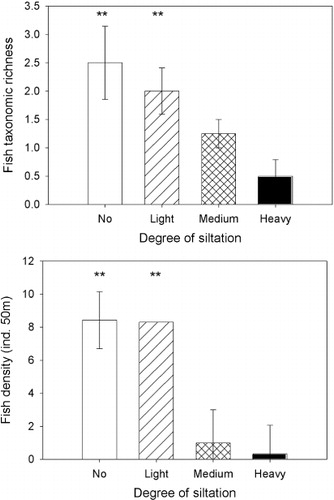
Sites were allocated to one of four categories of siltation (n = 4), statistically significant differences are shown with statistical values in text. **Indicates statistically significant differences at P < 0.01. Statistical values are shown in text. The absence of error bars indicates no variability.
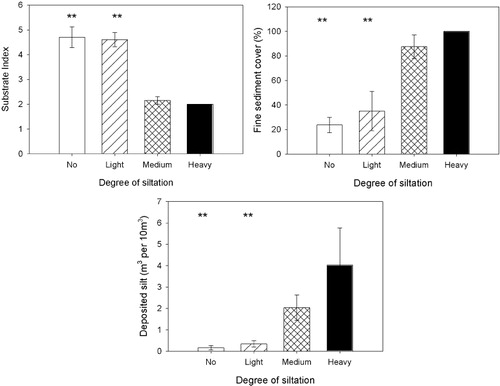
Table 1 Physical and chemical characteristics of 16 sites on the Avon and Heathcote rivers within four sediment categories (no silt, lightly silted, medium siltation and heavily silted) in September 2011.
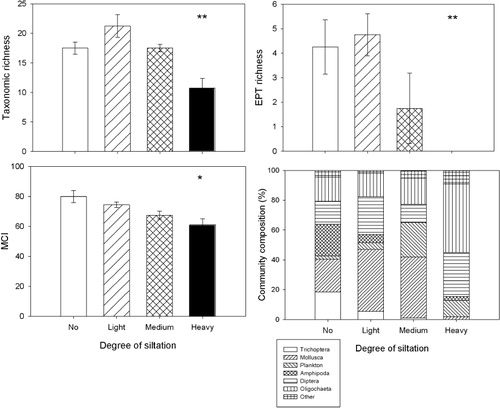
Sites were allocated to one of four categories of siltation (n = 4). **Indicates statistically significant differences at P < 0.01; * indicates statistically significant differences at P < 0.05. Statistical values are shown in text.
Sites were allocated to one of four categories of siltation (n = 4). **Indicates statistically significant differences at P < 0.01. Statistical values are shown in text. The absence of an error bar indicates no variability.