Figures & data
Figure 1. Example of a typical day of survey effort. Only dolphin sightings in the box inside Akaroa Harbour were used in this analysis.
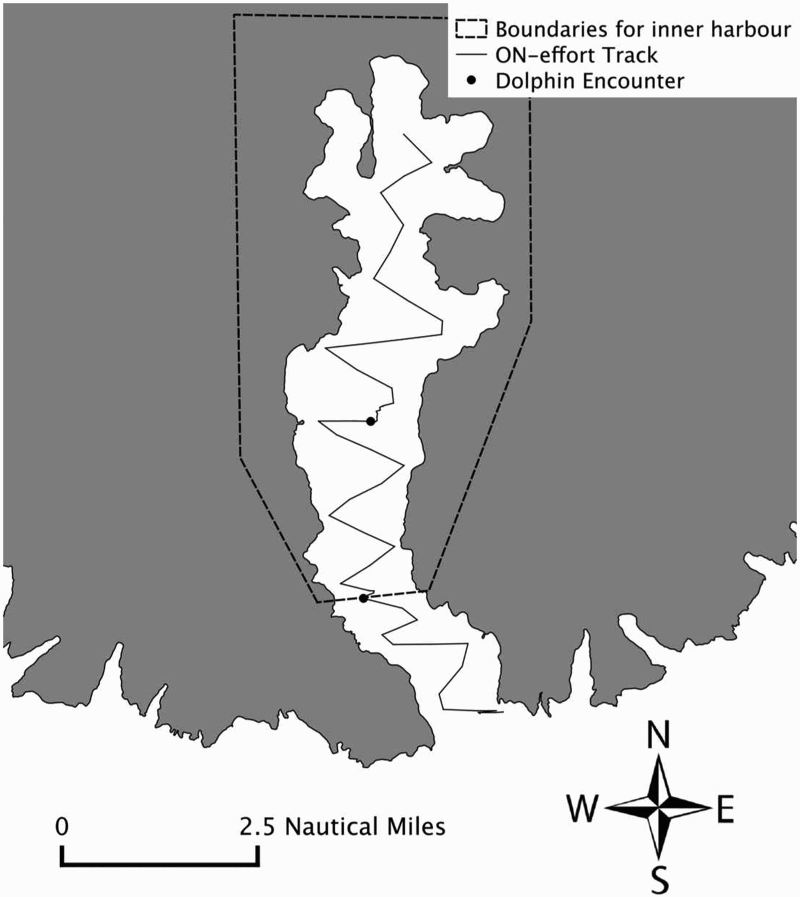
Figure 2. Map of Banks peninsula including Akaroa Harbour, the position of the wave buoy and the position of the T-PODs. Swell was separated by direction into swell that can run into Akaroa Harbour and swell that cannot. Therefore, swell from 280° to 100° was considered as swell from the north and swell from 100° to 280° as swell from the south.
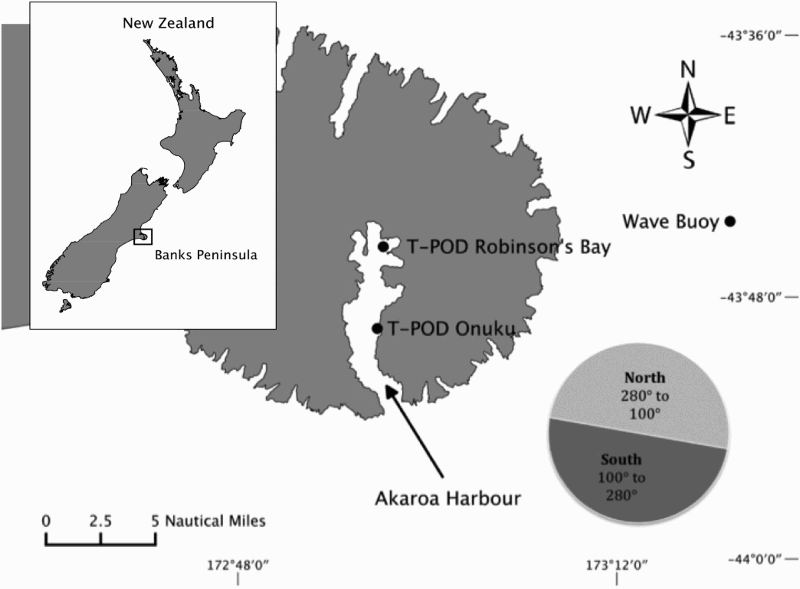
Figure 3. Frequency of swell directions recorded by the wave buoy off Banks Peninsula from March 2000 to February 2012.
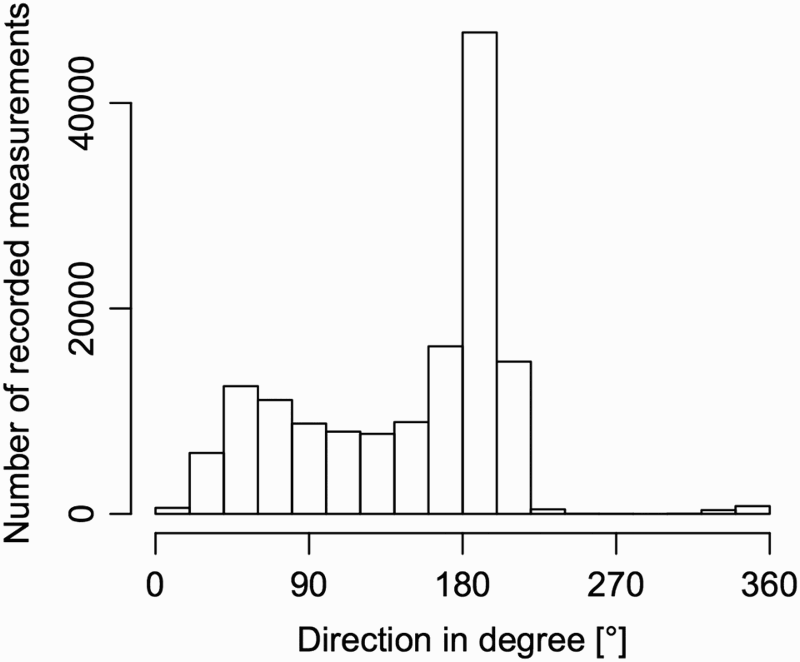
Figure 4. Sighting rates of Hector's dolphins (Cephalorhynchus hectori) plotted against swell height and direction on: A, the same day; B, 1 day prior; and C, 2 days prior to the observation. Grey lines present the linear models based on different swell directions (n = north, x = mixed, s = south). Swell height of the same day as the boat observation had no significant effect on the transformed sighting rate. However, swell height 1 day prior and 2 days prior to the boat observation had a significant negative effect on the transformed sighting rate. The effect of swell direction on the transformed sighting rate was significant for swells from 1 day prior to the boat observation only. Swell direction of the same day and 2 days prior had no significant effect. Mixed swell directions are days with swell from both the north and the south.
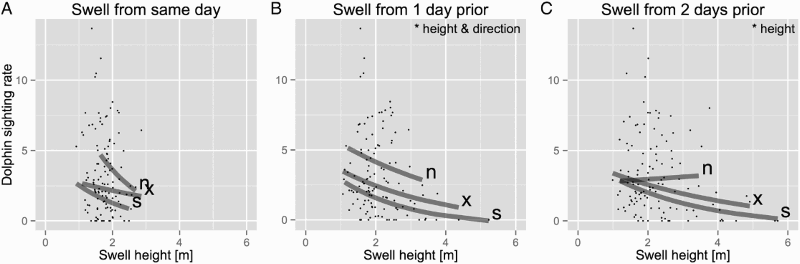
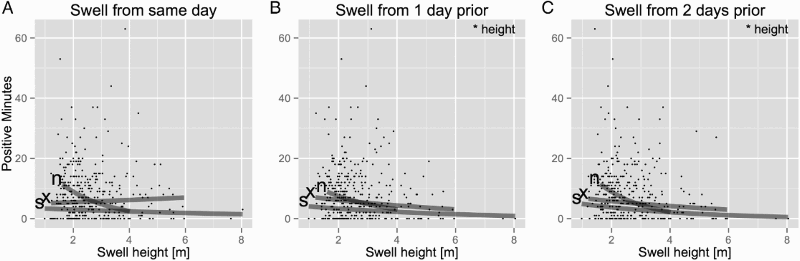
Figure 5. Dolphin-positive minutes of Hector's dolphins (Cephalorhynchus hectori) recorded at Robinson's Bay plotted against swell height and swell direction of: A, the same day; B, 1 day prior; and C, 2 days prior to the T-POD recording. Grey lines present the linear models based on different swell directions (n = north, x = mixed, s = south). The linear models showed no significant effect of swell height from the same day on dolphin-positive minutes. Swell height 1 day prior and 2 days prior to the recording had a significant negative effect on the transformed dolphin-positive minutes. Only swell direction from 1 day prior to the T-POD recording had a significant effect on the positive minutes. Neither swell direction of the same day nor of 2 days prior to the recording showed a significant effect. Mixed swell directions are days with swell from both the north and the south.
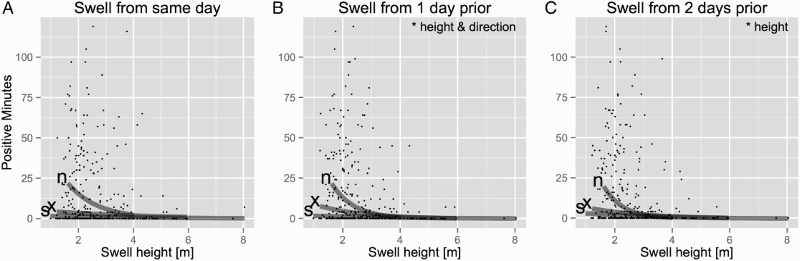
Figure 6. Dolphin-positive minutes of Hector's dolphins (Cephalorhynchus hectori) recorded at Onuku plotted against swell height and swell direction of: A, the same day; B, 1 day prior; and C, 2 days prior to the T-POD recording. Grey lines present the linear models based on different swell directions (n = north, x = mixed, s = south). The linear models showed no significant effect of swell height from the same day on dolphin-positive minutes. Swell height 1 day prior and 2 days prior to the recording had a significant negative effect on the transformed dolphin-positive minutes. Neither swell direction of the same day nor of 1 day prior nor of 2 days prior to the recording showed a significant effect at Onuku. Mixed swell directions are days with swell from both the north and the south.