Figures & data
Figure 1. Map showing fishing zones in the South Australian abalone fishery.
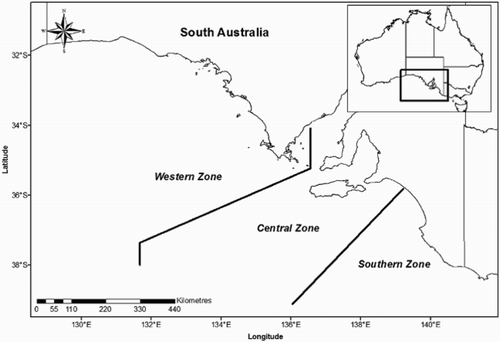
Figure 2. Scatterplots of CPUEFINAL against CPUEYTD (kg h−1) from for WZ, CZ and SZ and for high- and medium-importance SAUs from 1988–2012 for WZ and CZ, and 1988–2011 for the SZ. BL, blacklip (![]()
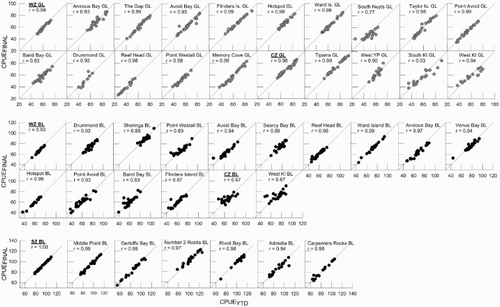
Figure 3. CPUE absolute percentage difference by month (±SEM) for zone-wide and selected SAUs compared with complete-season values for: A, entire fisheries; B, high-importance SAUs from WZ blacklip and greenlip; C, high-importance SAUs from CZ blacklip and greenlip from 1988–2012; and D, high-importance SAUs from SZ blacklip from 1988–2011. Reference line is at 5% CPUE difference. BL, blacklip; GL, greenlip; Is, Island; KI, Kangaroo Island.
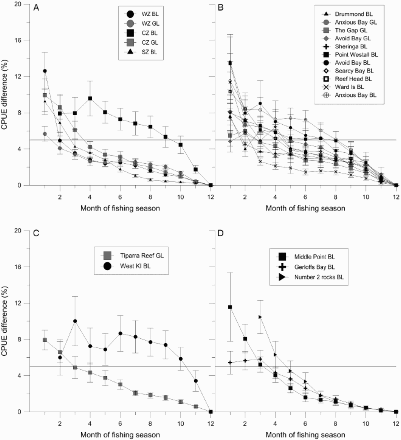
Figure 4. Box and whisker plot of absolute CPUE difference between year-to-date CPUE and complete-season CPUE values for entire zone and for all high- and medium-importance SAUs from WZ and CZ and selected SAUs from SZ for: A, greenlip; and B, blacklip WZ (1988–2012), CZ (1988–2012) and SZ (1988–2011). Boxes contain data between 25th and 75th quartiles with median marked by horizontal black line. Whiskers represent 5th and 95th percentiles. Reference line is at 5% CPUE difference. Is, Island; YP, Yorke Peninsula; KI, Kangaroo Island.
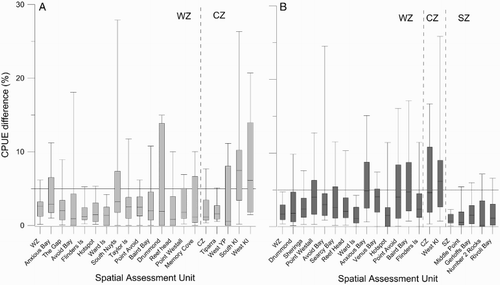
Figure 5. CPUE percentage difference between year-to-date CPUE and complete-season CPUE values for: A, WZ blacklip, CZ blacklip, SZ blacklip, WZ greenlip and CZ greenlip fisheries; B, high-importance SAUs from each fishery: Drummond blacklip, Sheringa blacklip, Pt Westall blacklip, Avoid Bay blacklip, Searcy Bay blacklip, Reef Head blacklip, Ward Island blacklip, Anxious Bay blacklip, Anxious Bay greenlip, The Gap greenlip, Avoid Bay greenlip, Tiparra Reef greenlip, West KI blacklip, Middle Point blacklip, Gerloffs Bay blacklip and Number 2 Rocks blacklip SAUs from 1988–2012 for WZ and CZ fisheries and SAUs, and SZ blacklip and SAUs from 1988–2011. BL, blacklip; GL, greenlip; SAU, spatial assessment unit; PT, Point; KI, Kangaroo Island. *no data available.
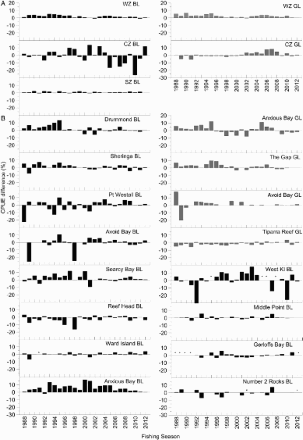
Figure 6. Part of season CPUE % difference compared with complete-season CPUE values for WZ greenlip, WZ blacklip, SZ blacklip, CZ greenlip and CZ blacklip against the number of harvest strategy qualifying records and the proportion of catch. Vertical lines represent the point in the fishing season at which the CPUE difference was consistently below 5% for 20 of the 25 years (80%) for WZ and CZ, and 19 of the 24 years (79%) for SZ. BL, blacklip; GL, greenlip.
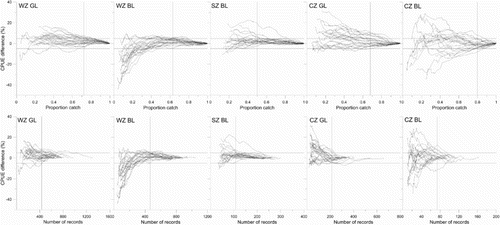
Figure 7. Cumulative monthly catch percentage for WZ blacklip, CZ blacklip, SZ blacklip, WZ greenlip and CZ greenlip fisheries (error bars are standard errors) for three time periods; WZ and CZ 25 years, SZ 24 years (![]()
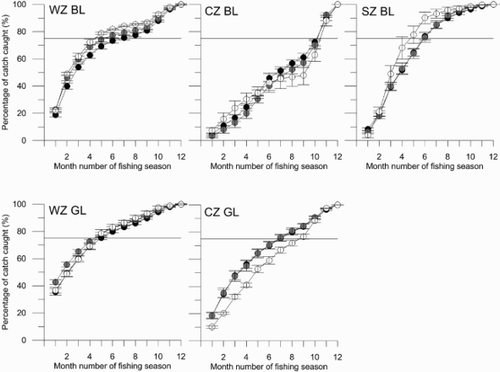
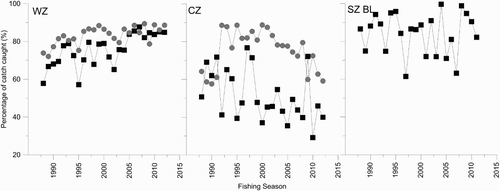
Figure 8. Percentage of TACC caught by the end of month seven for blacklip (![]()