Figures & data
Table 1. JIP test parameters with explanations and formulae (Strasser & Strasser Citation1995) calculated using data extracted from the O-J-I-P fast fluorescence transient.
Figure 1. Parameters observed when Cylindrospermopsis raciborskii was exposed to 0, 0.1, 0.5, 1, 2 and 4 mg·L−1 of linoleic acid for 48 h. A, Chlorophyll a concentration; B, mean growth rate (μ).
Figure 2. Rapid light curves of Cylindrospermopsis raciborskii exposed to 0, 0.1, 0.5, 1, 2 and 4 mg L−1 of linoleic acid for 48 h. Values shown are the means of three replicates ± SD.
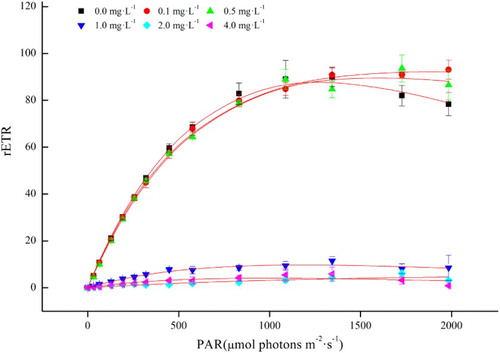
Table 2. Changes in photosynthetic parameters following different concentration treatments of linoleic acid in C. raciborskii.
Figure 3. Relative variable fluorescence (OJIP transient curve) of Cylindrospermopsis raciborskii after 48 h of incubation with 0, 0.1, 0.5, 1, 2 and 4 mg L−1 of linoleic acid.
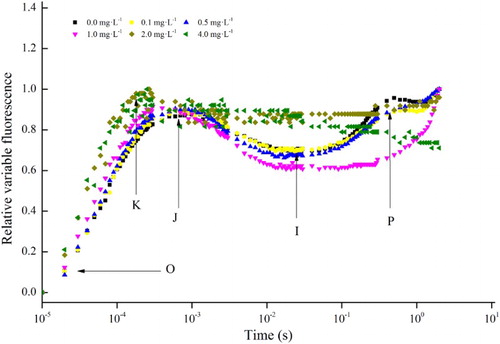
Figure 4. Changes in the JIP test parameters expressed as a percentage of the control when Cylindrospermopsis raciborskii was exposed to various concentrations of linoleic acid for 48 h. A, Absorption flux per RC (ABS/RC) and dissipated energy flux per RC (DI0/RC); B, RC parameters (RC/CS0), parameters related to QA reduction (φP0 and φE0) and performance index based on absorption (PIABS). For more information, see .
Figure 5. Parameters for Cylindrospermopsis raciborskii incubated with 0, 0.1, 0.5, 1, 2 and 4 mg L−1 of linoleic acid for 48 h. A, Superoxide dismutase (SOD) activity; B, catalase (CAT) activity; C, malondialdehyde (MDA) concentration. Error bars represent ± SD for triplicate treatments.