Figures & data
Figure 1. Map indicating locations of bluegill bully (Gobiomorphus hubbsi) nest searches on the Waianakarua River, South Island, New Zealand.
Figure 2. Newly hatched bluegill bully larva. Lines indicate morphological variables measured. A = notochord length, B = yolk sac diameter, C = eye diameter.
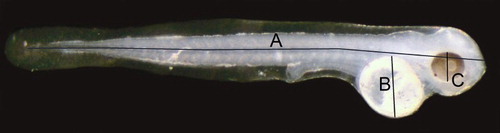
Figure 3. Notochord length (mean ± SEM; µm) of larval bluegill bully at hatch from 12 nests collected from the Waianakarua River, South Island, New Zealand. Nests marked with the same lowercase letter did not differ significantly (Tukey’s HSD test, alpha = 0.05). Dashed line represents mean notochord length of drifting larvae caught in situ (Jarvis & Closs Citation2015).
Figure 4. Relationships between mean yolk sac diameter and both notochord length (above) and eye diameter (below) of newly hatched clutches of bluegill bully larvae.
Figure 5. Percentage of larvae (mean ± SEM; N = 10 trials of 50 larvae each) present in illuminated area (10.5%) of an experimental aquaria at different light intensities after 3 min. Dashed line indicates expected percentage (10.5) based on a random distribution of larvae throughout the aquaria. Significance codes shown if percentage differed significantly from that expected at random as follows: * = p < .05, ** = p < .01, *** = p < .001.
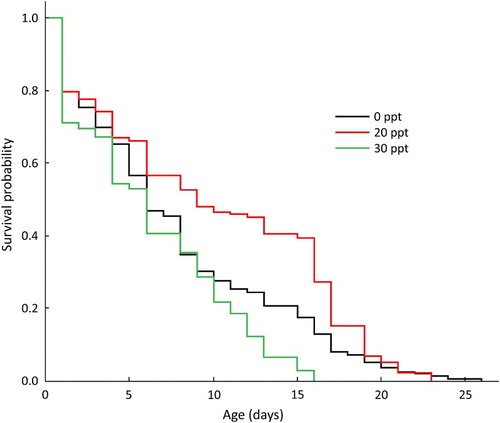
Figure 6. Kaplan–Meier survival curves showing survivorship through time of newly hatched bluegill bully at three salinity treatment levels.