Figures & data
Figure 1. Map showing location of the study area. Black dots in the Río de la Plata indicate the position of the sampling stations A1 through A11.
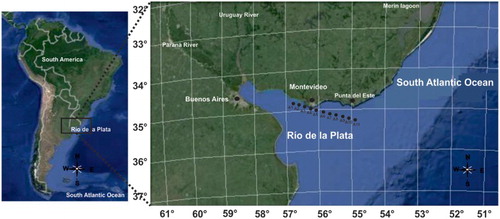
Table 1. Geographical coordinates (latitude and longitude), depth (Z), and environmental variables and measurements (OM = organic matter, Chl a = chlorophyll a, bottom and superficial salinity) of all 11 stations from the Río de la Plata (A1–A11).
Figure 2. Relative abundance of diatom species. Individual species are grouped according to salinity preferences on left side of diagram and into salinity-habitat group at right side as follows: the freshwater planktonic (FP) and benthic (FB), brackish planktonic (bP) and benthic (bB), and marine planktonic (MP), benthic (MB) and tychoplanktonic (MT). Furthermore, clustering groups and observed superficial and bottom salinity are shown to the right of the plot.
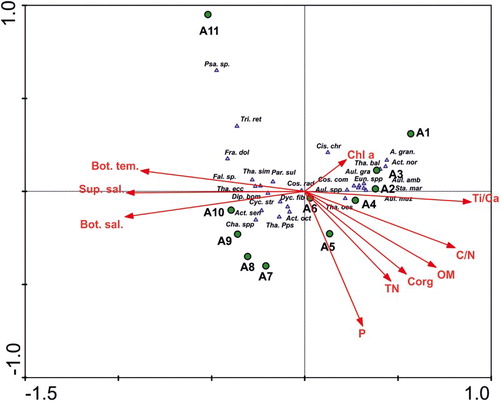
Figure 3. CCA tripolt ordination diagram showing position of species (triangles), sites (circles) and environmental variable (arrows). The axes 1 and 2 presented 60.9% and 75.5% of the accumulated variance, respectively. P, C/N, TN (total nitrogen), Corg (organic carbon) and Ti/Al data were extracted from Burone et al. (Citation2013).