
Figures & data
Table 1. Lethal concentrations LC10, LC50, and LC99 (n = 16) with 95% CIs for the chemicals tested on Daphnia pulex at different exposure times.
Figure 1. Mortality of A, D. pulex, B, A. brightwelli, and C, S. pallidus exposed to 9, 18, or 36 W of UV-C for various amounts of time. Values are means ± standard errors of numbers retained per 10 cm2 sample unit (n = 3).
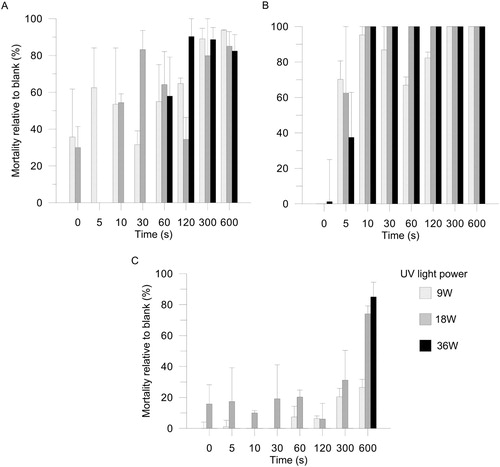
Figure 2. Mortality of D. pulex on A, wool or B, felt treated with sodium chloride solutions for various amounts of time. Values are means ± standard errors of numbers retained per 10 cm2 sample unit (n = 3).
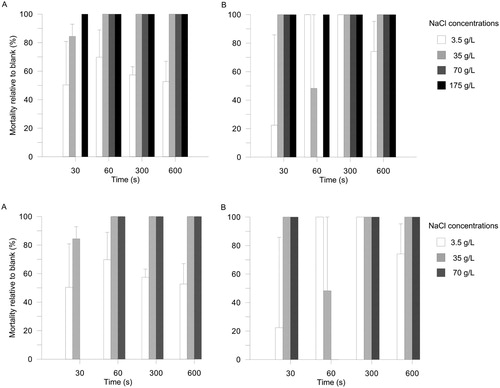
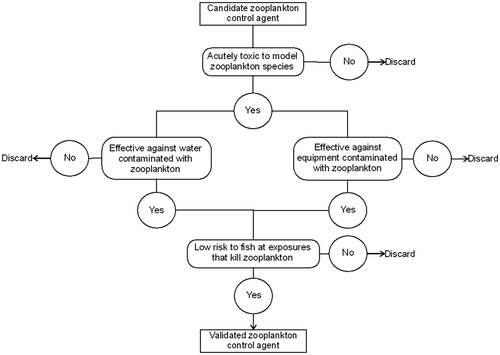
Figure 3. Decision tree illustrating the approach used to select effective chemical treatment.
Supplemental material