
Figures & data
Figure 1. Location of study catchments in Waitaha Canterbury. GIS layers downloaded in 2016 (LRIS Citation2012; Canterbury Maps Citation2015; LINZ Citation2015).
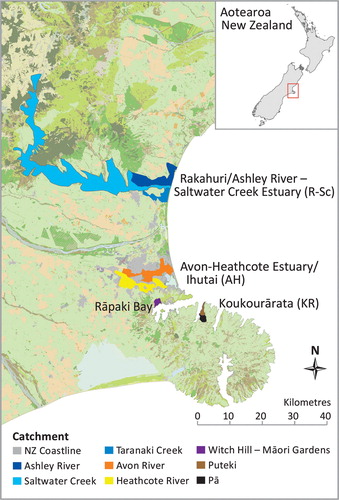
Table 1. Number of Local Practitioners and Specialists (LPS), Recreational Participants (RP) and participant experience (years) surveyed across four Waitaha estuaries.
Figure 2. Perceived environmental score by Local Practitioners and Specialists (LPS, n = 5–7) and Recreational Participants (RP, n = 20–21) at each site and catchment.
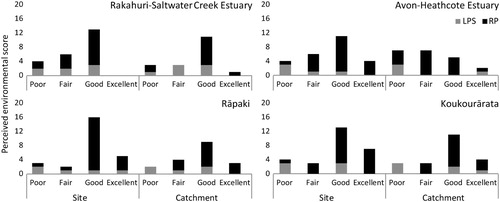
Figure 3. Perceived environmental score grouped by less experienced (<19 years, n = 45–50) and experienced participants (20–30 years, n = 34–38) at each site and catchment.
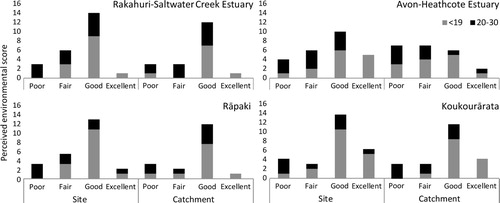
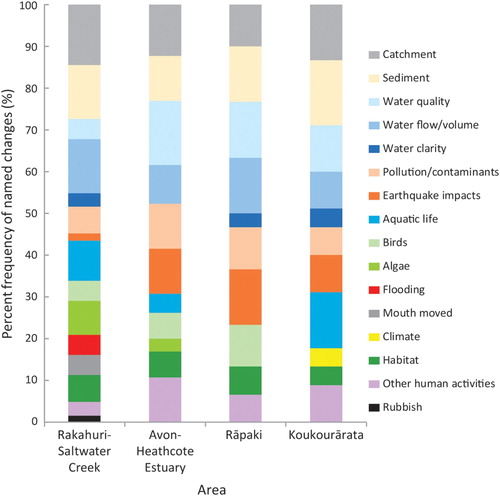
Figure 4. Percent frequency of the main environmental changes identified by participants (LPS n = 21 and RP n = 37) at each estuary.
Supplemental material