Figures & data
Figure 1. The linear trend in SST 1981–2017 calculated from the NOAA OI SST V2 High Resolution Dataset (Reynolds et al. Citation2007; Banzon et al. Citation2016). Regions where the trends are not statistically significant are shaded in white. Contour intervals are 0.05°C/decade. Locations where anomalies are shown later are highlighted.
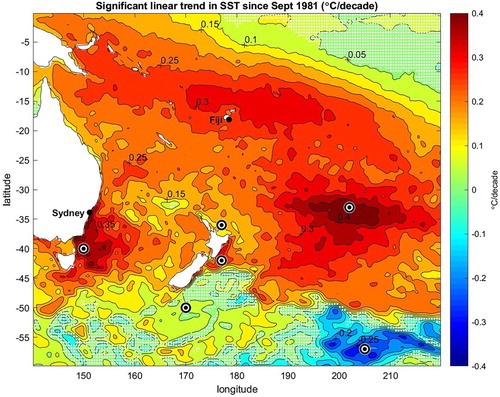
Figure 2. As for , but focusing on the New Zealand region. Contour intervals are 0.02°C/decade.
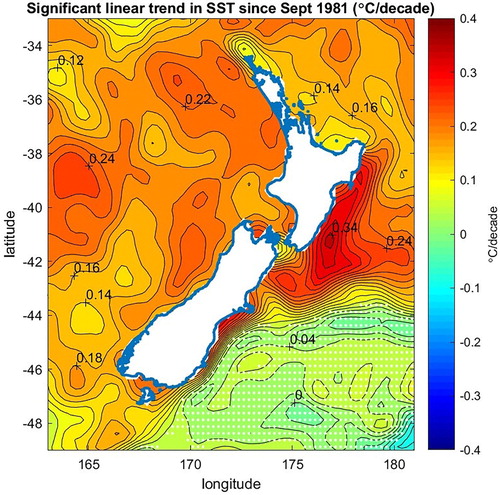
Figure 3. A, The New Zealand Seven Station locations (green). The locations near the coast selected to build a near-coastal timeseries (red). B, the timeseries of annually-smoothed temperature anomaly near the coast. The y axis begins at the southern-most location south of Stewart Island, then runs north along the east coast to North Cape (shown by the black line) before running south along the west coast.
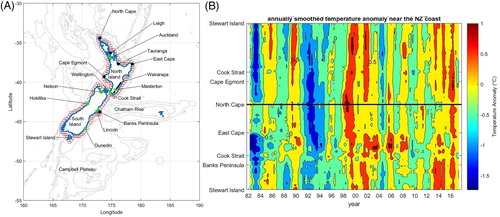
Figure 4. Daily and annually-smoothed temperature anomalies together with trends for six locations (shown on ) in the southwest Pacific. Means and seasonal cycles have been removed.
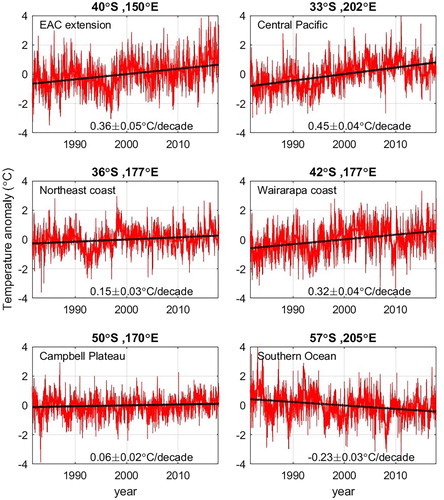
Figure 5. A, Three representative areas. B, Spatially-averaged daily SST anomalies for the three regions (with means and seasonal cycles removed), together with annually-smoothed timeseries and linear trends. Daily anomalies more than two standard deviations from the mean are shown in bold.
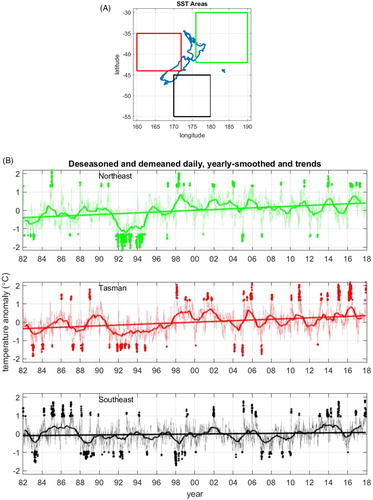
Figure 6. A, locations of the XBT casts used in the analysis of ocean temperatures between New Zealand and Fiji from repeat HRXBT line PX06. B, linear trends in temperature between the surface and 850 m along the mean HRXBT track. Regions where the trend is not significant are shaded in white. Contour intervals are 0.05°C/decade.
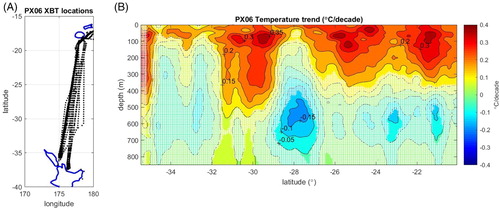
Figure 7. A, locations of the XBT casts used in the analysis of Tasman Sea temperatures from repeat HRXBT line PX34. B, linear trends in temperature between the surface and 850 m along the mean HRXBT track. Regions where the trend is not significant are shaded in white. Contour intervals are 0.05°C/decade.
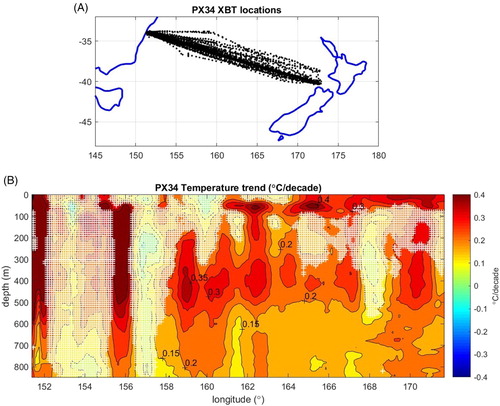
Figure 8. Comparison of SST, 5 m HRXBT and 0–5 m Argo timeseries for locations along the northern PX06 transect (A) and the Tasman PX34 transect (B). All timeseries have had means and seasonal cycles subtracted and been annually smoothed with a 12-month running mean filter. The linear trends from each timeseries are also shown.
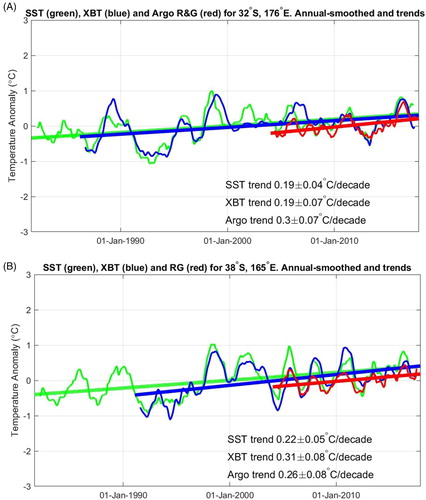
Figure 9. Depth at which the correlation with the surface falls to 0.7 for deseasoned, seasonal data. Based on Argo (RG climatology). Contours are at 20 m intervals.
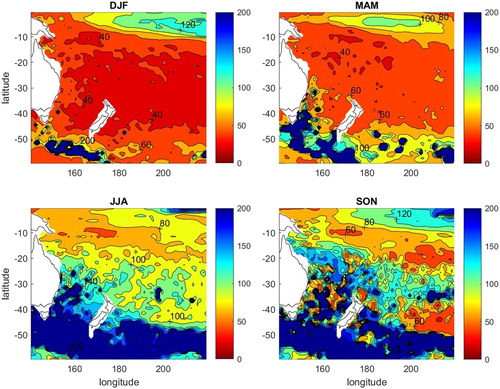
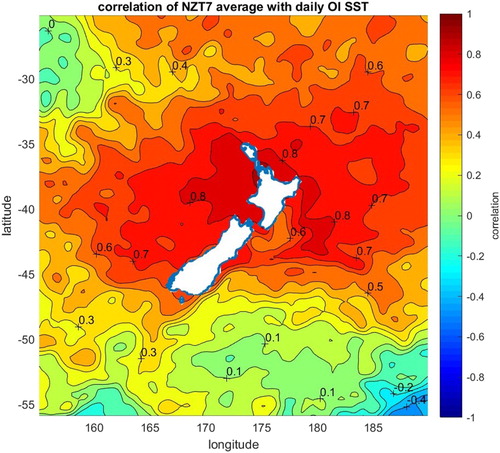
Figure 10. Correlation of annual-average SST with mean of terrestrial New Zealand Seven Station record (annually-averaged).