Figures & data
Figure 1. Definitions of terms used to describe burying behaviour used in the experiment.
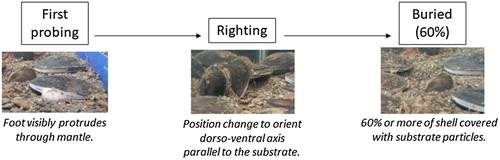
Table 1. descriptions and photos of transport vessels used in the experiment.
Figure 2. Scatterplots showing correlations between (top) time at being buried and time at first probing and (bottom) total burying duration and time at first probing.
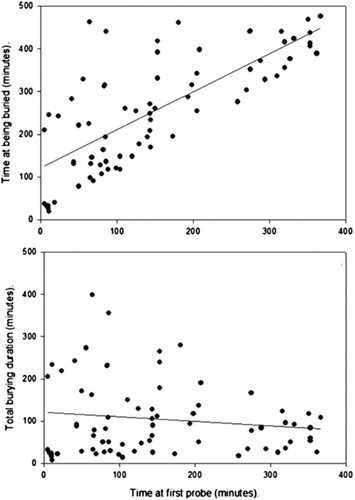
Figure 3. Behaviour curves generated from survival analysis performed on kākahi that probed during the first two hours of observation. Each curve represents one of the transport treatments (bucket, kete, hybrid) and shows the times at which probing occurred in each group.
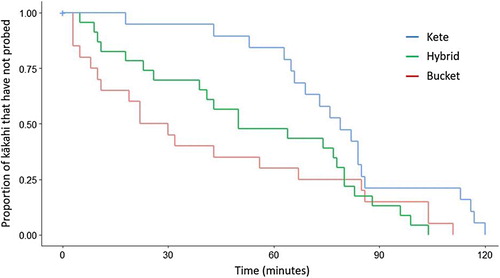
Figure 4. Behaviour curves generated from survival analysis performed on kākahi that completed (clockwise from top left) probing, righting, and burying. Each curve represents one of the transport treatments (bucket, kete, hybrid) and shows the times at which burrowing behaviour occurred in each group.
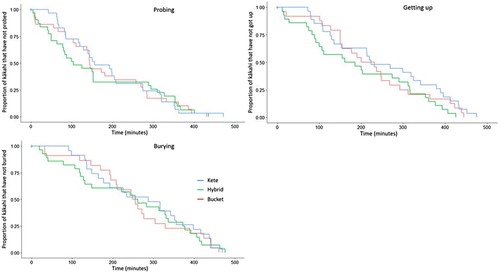
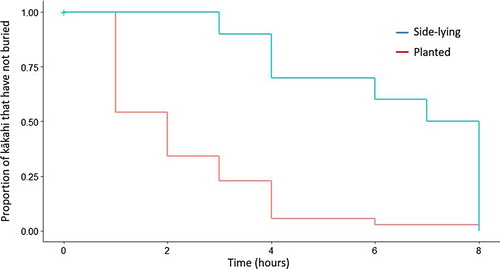
Figure 5. Behaviour curves generated from survival analysis performed on kakahi that completed burying during the observation period. Each curve represents one of the release treatments (planted and side-lying) and shows the times at which burying occurred in each group.