Figures & data
Figure 1. Movement dynamics of Jasus edwardsii between zones and sub-regions within Victoria, Australia Solid black line represents border between Western and Eastern zones.
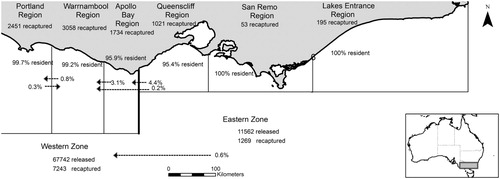
Figure 2. Distance travelled (km) by Jasus edwardsii based on each capture-recature location in Victoria.Numbers above bars reflect recaptures.
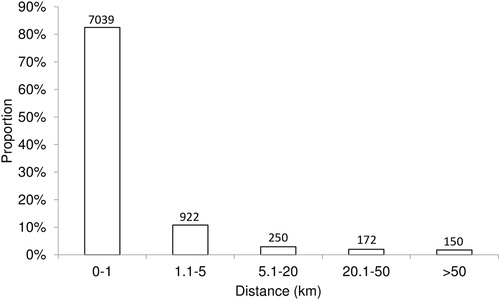
Figure 3. Distance travelled (km) versus Time-at-large (days) by Jasus edwardsii in Victoria.
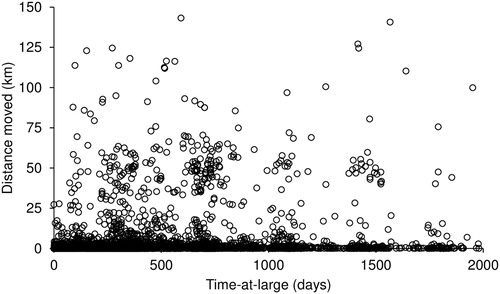
Figure 4. (A–D) Movement patterns of Jasus edwardsii in Victoria by region (A), depth (B) size (C) and sex and reproductive condition (D). Median values are indicated by the horizontal bar; length of the box is the inter-quartile range; whiskers represent quartiles; circles are data points; and diamonds are the mean.
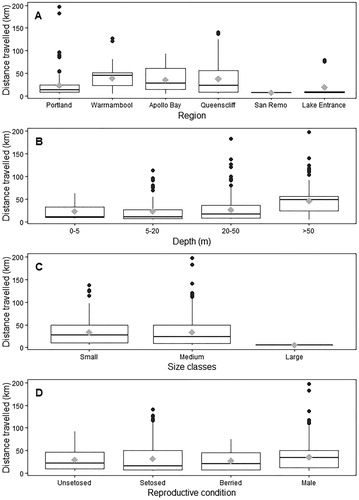
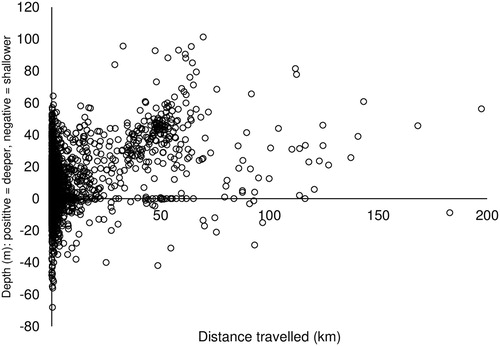
Figure 5. Movement patterns of Jasus edwardsii in Victoria by depth.