
Figures & data
Figure 1. Microplastic distributions across all 52 study sites, expressed as the number of microplastic items per m3 of water, by size categories (a) and shape categories (b). The violin plot outlines illustrate kernel probability density with the width of the shaded area representing the proportion of data found at this concentration (van der Bijl et al. Citation2015).
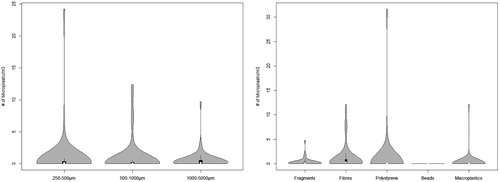
Figure 2. Microplastic composition in size classes (a) and identification classes (b).
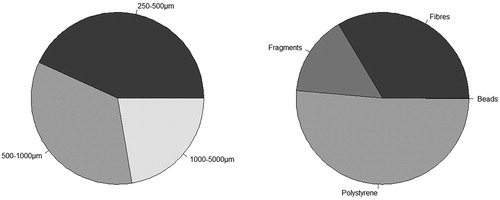
Figure 3. (a) Mean total number (LN-transformed) of microplastic items caught during the 15-minute sampling period by region (DF = 4, p = 0.57, eta2 = 0.06) and (b) mean fourth-root number of microplastics per m3 of water by region (DF = 4, p = 0.47, eta2 = 0.07).
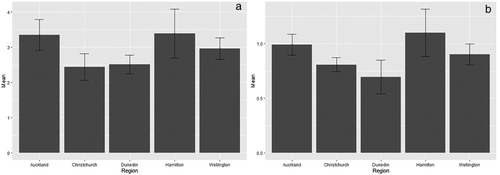
Table 1. The 16 most polluted stream sites based on microplastic concentrations per m3. Shown are total microplastic items per site caught in 15 minutes, total numbers extrapolated over 24 hours (based on the flow velocities measured during sampling), and microplastic concentrations/m3 for each size class and identification class.
Figure 4. The four strongest (in relative terms) relationships from the multiple linear regression analysis. A. Total microplastic items (LN-transformed) versus channelisation (R2 = 0.08, p = 0.05), B. 1000–5000 µm microplastics/m3 (LN) versus channelisation (R2 = 0.07, p = 0.06), C. Microplastic fibres/m3 (LN) versus stream width (m) (R2 = 0.10, p = 0.02), D. Polystyrene/m3 (LN) versus channelisation (R2 = 0.06, p = 0.08). Note that 0.01 was added to the three microplastic concentration variables before LN-transformation because they contained zeros.
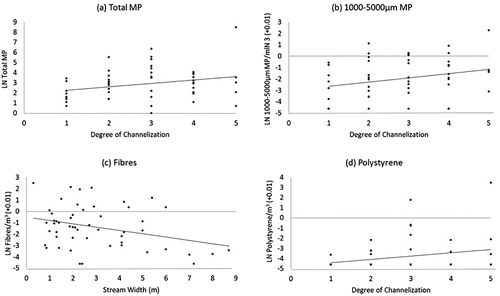
Table 2. Multiple linear regression outputs for microplastic (MP) response variables and the six continuous predictor variables (stream length, urban catchment length, proportion of urbanised catchment, water flow velocity, channelisation and stream width). Beads were too rare to be included in this analysis.
Table 3. Comparisons of microplastic concentrations/m3 between our stream survey and Dikareva and Simon (Citation2019) across the same five stream sites. All five sites were sampled at moderate flows in both studies.
Supplementary Information
Download MS Word (5.6 MB)Data availability
The datasets generated during the current study are available from the corresponding author on reasonable request.