
Figures & data
Figure 1. Map of New Zealand indicating sampling locations and areas of interest. AI: Auckland Islands; CR: Chatham Rise; CP: Castlepoint; CK: Cape Kidnappers; WI: White Island; MI: Mercury Islands. Latitude, longitude, 200 m isobath, and 1000 m isobath shown.
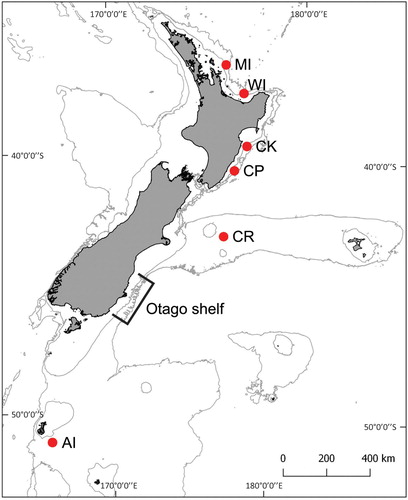
Table 1. Sampling information, summary statistics, estimates of genetic diversity, and neutrality test statistics for 321 partial NZ scampi CO1 sequences. For neutrality test values (Tajima's D and Fu's F-statistic), bold values indicate statistical significance. Key: n: Sample Size, S: Segregating Sites, TS: Transitions, TV: Transversions, HN: Number of Haplotypes, HP: Number of Private Haplotypes, HD: Haplotype Diversity, π: Nucleotide Diversity (standard deviation), k: Average Number of Nucleotide Substitutions.
Figure 2. Bayesian analysis of population structure with k = 5. A total of 321 samples are represented. Colours represent different genetic clusters defined by BAPS. MI = Mercury Islands; WI: White Island; CK: Cape Kidnappers; CP: Castlepoint; CR: Chatham Rise; AI: Auckland Islands.
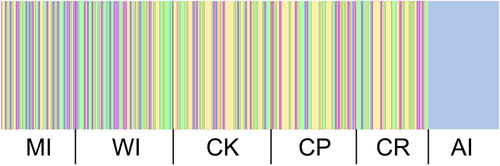
Figure 3. Median-joining haplotype network of 321 partial NZ scampi CO1 sequences. Each hatch mark represents one mutational step, while small black circles represent hypothetical unsampled haplotypes.
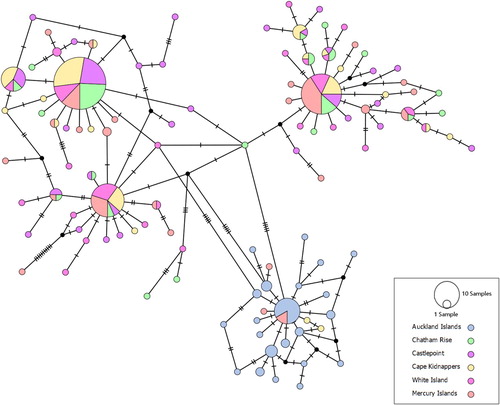
Table 2. Analysis of Molecular Variance (AMOVA) analyses of M. challengeri using 321 CO1 sequences with 3 a priori geographic groupings. (1) AI, MI-CR: Group 1: Auckland Islands, Group 2: Chatham Rise, Castlepoint, Cape Kidnappers, White Island, Mercury Islands. (2) AI, CR, MI-CP: Group 1: Auckland Islands, Group 2: Chatham Rise, Group 3: Castlepoint, Cape Kidnappers, White Island, Mercury Islands. (3) AI+CR, MI-CP: Group 1: Auckland Islands, Chatham Rise, Group 2: Castlepoint, Cape Kidnappers, White Island, Mercury Islands. d.f. = degrees of freedom, Var = variance component, %Var = variance component in percentage of total variation.
Table 3. Pairwise ɸST values determined by CO1 haplotype frequencies. Pairwise ɸST values were determined using 321 CO1 sequences and the haplotype frequencies between sampling localities. These are situated below the diagonal while the p-value associated with each comparison is located above the diagonal. Bold values indicate statistical significance after Bonferroni correction.
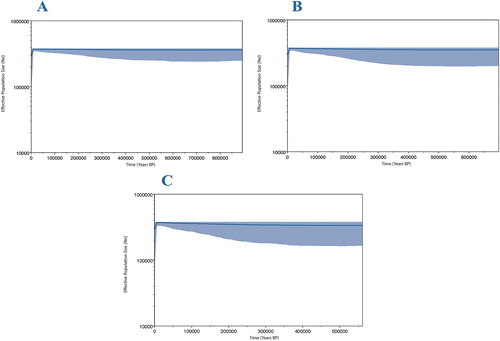
Figure 4. Bayesian skyline plots with differing mutation rates reconstructing changes in NZ scampi effective population size through time. A: 7 × 10⁻⁹ substitutions/site/year. B: 1 × 10⁻⁸ substitutions/site/year. C: 1.3 × 10⁻⁸ substitutions/site/year. The blue-shaded areas represent 95% confidence intervals.
Supplemental material
Download MS Word (614.3 KB)Data availability statement
The DNA sequences generated for this study are available on Figshare. DOI:10.6084/m9.figshare.11465565