Figures & data
Figure 1. Multiple direct and indirect impacts of water quality change on hapu wellbeing.
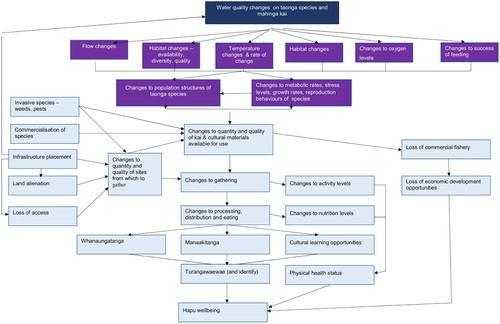
Figure 2. Locations of the 73 sites used to examine relationships between Māori values and landcover in three catchments.
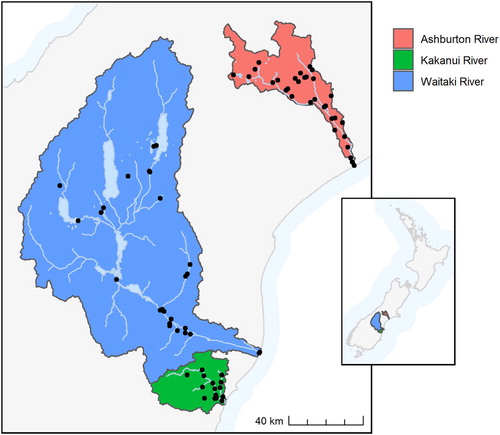
Table 1. Covariates used to examine relationships between landcover and Māori values. Vegetation classes are defined in Appendix 1.
Table 2. Parameter estimates of the models for Overall Health and Cultural Land Use scores.
Figure 3. Percentage of the upstream catchment covered in exotic pasture (usExoticPasture) and native vegetation (usNative) in 2012 (A) and change in land cover between 2001–2012 (B).
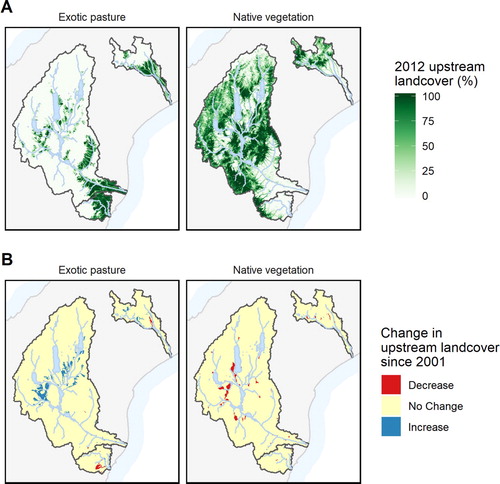
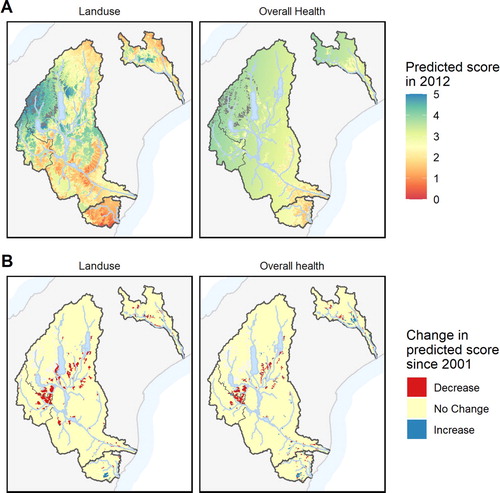
Figure 4. Predicted Māori values across the three study catchments. The Ahuriri catchment located at the top-left of the Waitaki catchment is outlined with a small grey line for each map. This catchment is used in the Discussion as an example of how the model outputs could be used by Māori.