
Figures & data
Figure 1. Left: Map of study sites in Wellington Harbour, New Zealand. The green circles mark the three sample sites: Evans Bay, Shark Bay, and Mahanga Bay. The red circles represent stormwater pipe outlets (Wellington City Council, n.d.). Note the higher concentration of stormwater pipe outlets closer to the Evans Bay site. Right: Map of the wider Wellington Harbour. Inset shows the location relative to Aotearoa New Zealand.
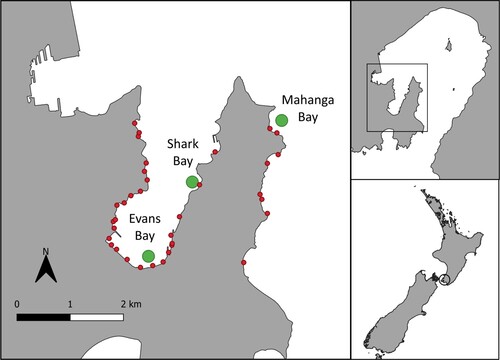
Figure 2. Example fluorescent microscopy images of some of the fibres (upper row) and fragments (lower row) of plastic found within sponge tissue from six different species in Wellington Harbour.
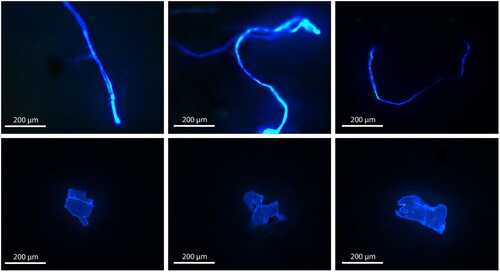
Figure 3. The total number of PMPs per gram of sponge tissue for six sponge species sampled across three sites (note that not all species were sampled at each site). The box size represents the upper and lower quartiles of the data. The middle line shows the median value and the symbol × shows the mean value. The whiskers indicate the variability of the data outside of the interquartile range. Individual data points are shown.
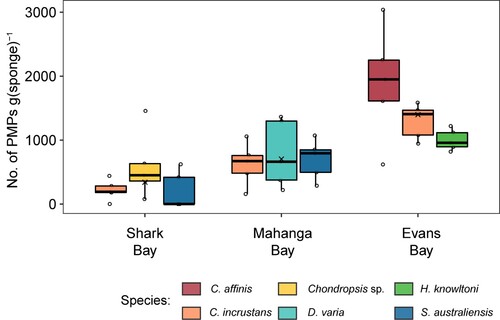
Table 1. The adjusted mean total PMP counts and the mean PMPs per gram (total, fibres, and fragments) values with standard error values for each sponge species at sampled in Wellington Harbour.
Figure 4. The number of PMP fibres, PMP fragments, and PMP totals per gram of sponge tissue pooled across six species at three different sites in the Wellington Harbour. The box size represents the upper and lower quartiles of the data. The middle line shows the median value and the symbol × shows the mean value. The whiskers indicate the variability of the data outside of the interquartile range. Individual data points are shown.
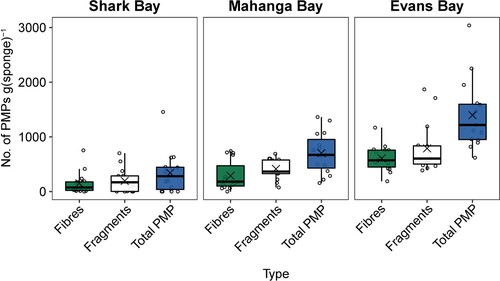
Figure 5. The proportion of PMP fibres (green) and fragments (white) for six sponge species across three sites in Wellington Harbour.
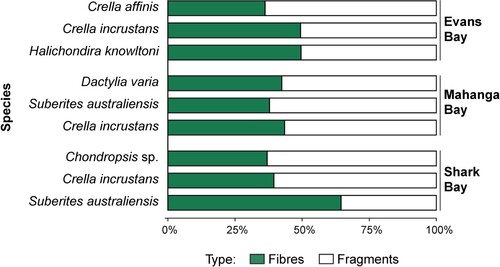
Figure 6. Concentration of fibres, fragments, and total PMPs at three sites in Wellington Harbour pooled across six sponge speices, categorised into PMPs under and over 100 µm. The box size represents the upper and lower quartiles of the data. The middle line shows the median value and the symbol × shows the mean value. The whiskers indicate the variability of the data outside of the interquartile range. Individual data points are shown.
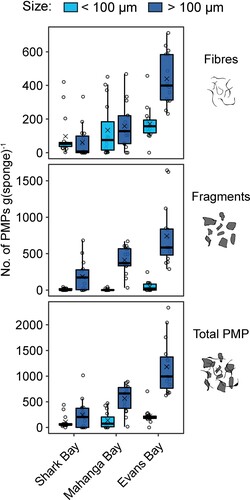
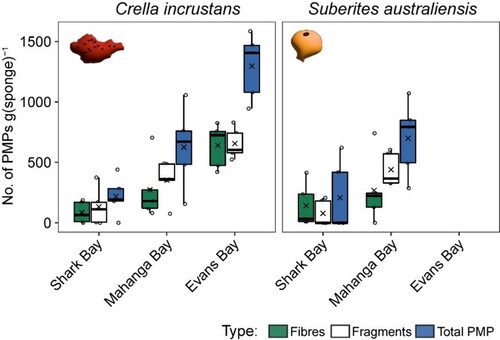
Figure 7. The total PMP fibres and fragments per gram and the combined total PMPs per gram of sponge tissue for Crella incrustans and Suberites australiensis at three sites in Wellington Harbour. The box size represents the upper and lower quartiles of the data. The middle line shows the median value and the symbol × shows the mean value. The whiskers indicate the variability of the data outside of the interquartile range. Individual data points are shown.
Supplementary Tables
Download MS Word (42.2 KB)Supplemental figures
Download MS Word (247.8 KB)Data availability
All data are available on request.