
Figures & data
Figure 1. Map showing the 10 coastal Marine Ecoregions of the World (MEOW) ecoregions (bottom, solid borders) and eight coastal Department of Conservation (DOC) sub-regions nested within ‘Central’ and ‘South’ New Zealand (top, solid fill).
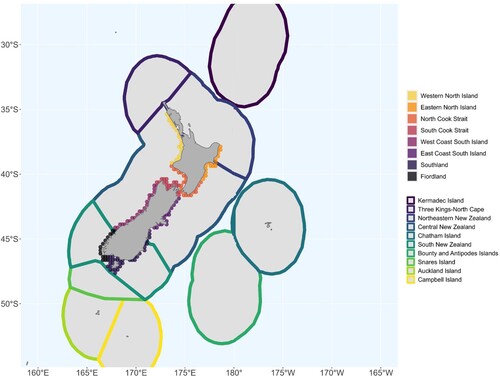
Figure 2. Time series of daily in situ T (blue) and adjacent offshore satellite-derived SST (red) for (a) Leigh Marine Laboratory, (c) Evans Bay and (e) Portobello Marine Laboratory. Time series of the annual number of marine heatwave days per year for (b) Leigh Marine Laboratory, (d) Evans Bay and (f) Portobello Marine Laboratory. Also shown are the Sen Slopes of the in situ and satellite-derived time series together (bold lines) together with their 95% confidence intervals (shading).
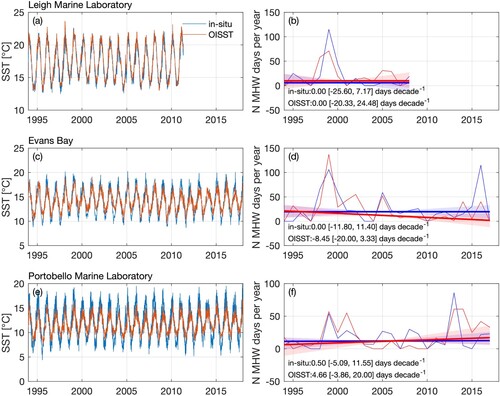
Figure 3. Seasonal trend analyses on number of MHW days, number of MHW events, mean intensity, maximum intensity, and cumulative intensity (bars from left to right, respectively; 4 seasonal analyses per metric [Winter, Spring, Summer, Autumn]; orange positive, purple negative trend) for all New Zealand (All NZ Region) and for 10 coastal (12 NM) ecoregions. Of the 200 analyses (10 regions x 5 metrics x 4 seasons, see ), 69.5% of cases increased and 30.5% were unaffected.
![Figure 3. Seasonal trend analyses on number of MHW days, number of MHW events, mean intensity, maximum intensity, and cumulative intensity (bars from left to right, respectively; 4 seasonal analyses per metric [Winter, Spring, Summer, Autumn]; orange positive, purple negative trend) for all New Zealand (All NZ Region) and for 10 coastal (12 NM) ecoregions. Of the 200 analyses (10 regions x 5 metrics x 4 seasons, see Figures 6–10), 69.5% of cases increased and 30.5% were unaffected.](/cms/asset/b3cdc16e-40af-43a2-9e90-9a896bce8875/tnzm_a_2218102_f0003_oc.jpg)
Figure 4. New Zealand general trends from January 1982 to December 2021 in the yearly-and-grid cell-averaged number of MHW days, number of MHW events, mean intensity (°C), maximum intensity (°C), and cumulative intensity (°C days) of MHWs within coastal (12 NM) ecoregions. The thick lines show loess smoothing (shading represents ±95% confidence interval around smoothing). Vertical lines indicate break-point year (thick = significant, dashed = non-significant).
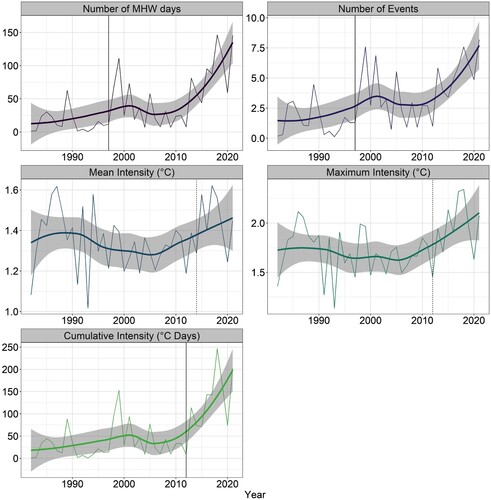
Figure 5. Seasonal trends in satellite derived mean SST from 1982 to 2021 by coastal (12 NM) ecoregion. The thick lines show loess smoothing (shading is ±95% confidence interval around smoothing).
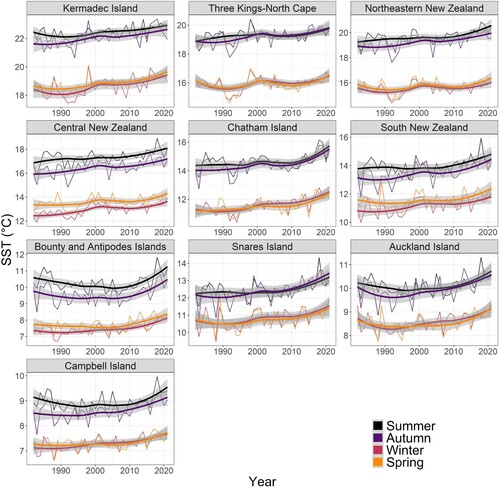
Figure 6. Seasonal trends from 1982 to 2021 in the year-and-grid cell-averaged MHW days per 12 NM coastal ecoregions and season (thin lines). Thick lines (significant trend) and dashed lines (non-significant trend) show loess smoothing (±95% confidence interval around smoothing) by season. Vertical lines indicate break-point year (thick = significant, dashed = non-significant).
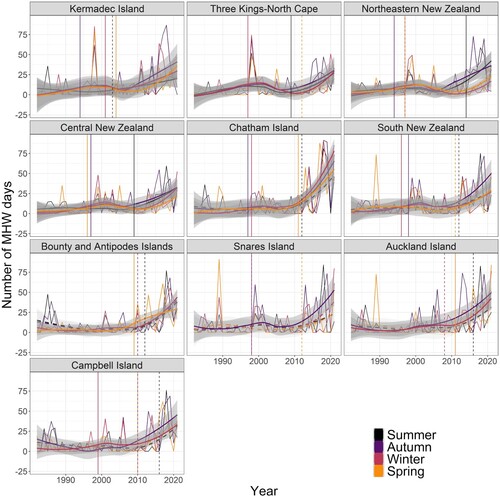
Figure 7. Seasonal trends from 1982 to 2021 in the year-and-grid cell-averaged MHW events per 12 NM coastal ecoregions and season (thin lines). Thick lines (significant trend) and dashed lines (non-significant trend) show loess smoothing (±95% confidence interval around smoothing) by season. Vertical lines indicate break-point year (thick = significant, dashed = non-significant).
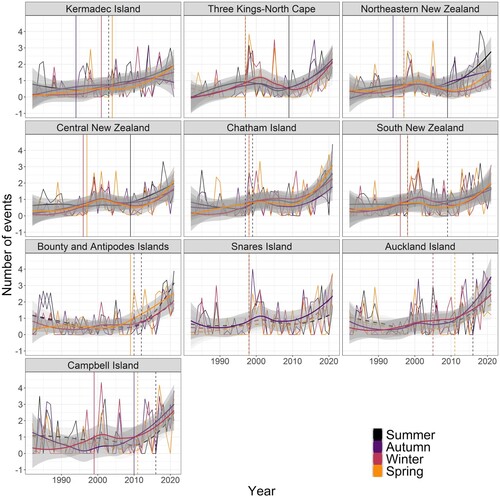
Figure 8. Seasonal trends from 1982 to 2021 in the year-and-grid cell-averaged MHW mean intensity (°C) per 12 NM coastal ecoregions and season (thin lines). Thick lines (significant trend) and dashed lines (non-significant trend) show loess smoothing (±95% confidence interval around smoothing) by season. Vertical lines indicate break-point year (thick = significant, dashed = non-significant).
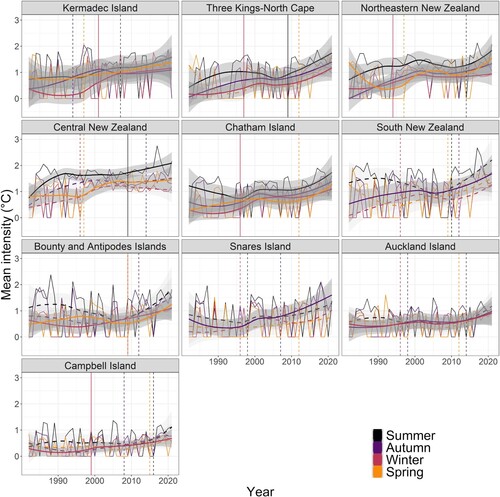
Figure 9. Seasonal trends from 1982 to 2021 in the year-and-grid cell-averaged MHW maximum intensity (°C) per 12 NM coastal ecoregions and season (thin lines). Thick lines (significant trend) and dashed lines (non-significant trend) show loess smoothing (±95% confidence interval around smoothing) by season. Vertical lines indicate break-point year (thick = significant, dashed = non-significant).
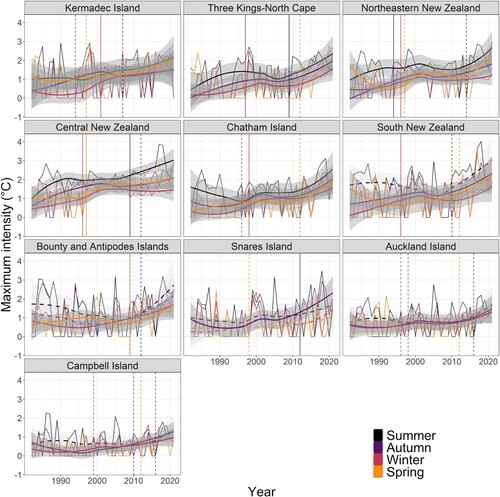
Figure 10. Seasonal trends from 1982 to 2021 in the year-and-grid cell-averaged MHW cumulative intensity (°C days) per 12 NM coastal ecoregions and season (thin lines). Thick lines (significant trend) and dashed lines (non-significant trend) show loess smoothing (±95% confidence interval around smoothing) by season. Vertical lines indicate break-point year (thick = significant, dashed = non-significant).
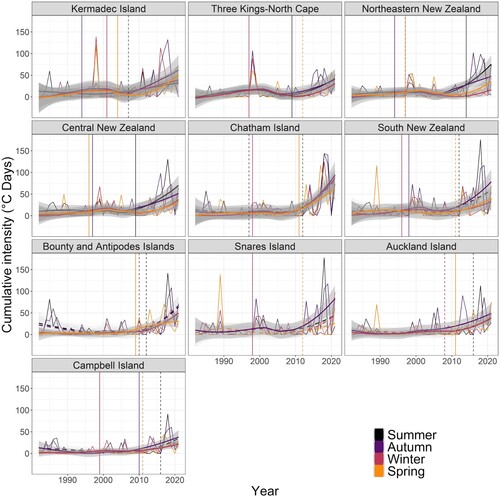
Figure 11. Seasonal trend analyses on number of MHW days, number of MHW events, mean intensity, maximum intensity, and cumulative intensity (bars from left to right; 4 seasonal analyses per metric [Winter, Spring, Summer, Autumn]; orange positive, purple negative trend). Eight 12 NM coastal sub-regions nested within ‘Central’ (n = 6) and ‘South’ (n = 2) New Zealand ecoregions. Of the 120 (6 sub-regions × 5 metrics × 4 seasons) and 40 (2 sub-regions × 5 metrics × 4 seasons) trend analyses for ‘Central’ and ‘South’ New Zealand (Figs. S2-S7), 76% (60%) increased significantly and 24% (40%) were unaffected, respectively.
![Figure 11. Seasonal trend analyses on number of MHW days, number of MHW events, mean intensity, maximum intensity, and cumulative intensity (bars from left to right; 4 seasonal analyses per metric [Winter, Spring, Summer, Autumn]; orange positive, purple negative trend). Eight 12 NM coastal sub-regions nested within ‘Central’ (n = 6) and ‘South’ (n = 2) New Zealand ecoregions. Of the 120 (6 sub-regions × 5 metrics × 4 seasons) and 40 (2 sub-regions × 5 metrics × 4 seasons) trend analyses for ‘Central’ and ‘South’ New Zealand (Figs. S2-S7), 76% (60%) increased significantly and 24% (40%) were unaffected, respectively.](/cms/asset/5201c4ce-d1ee-4b71-b413-5ed3e861f54b/tnzm_a_2218102_f0011_oc.jpg)
Supplemental material
Download MS Word (4.4 MB)Data availability statement
NOAA Optimum Interpolation (OI) SST V2 data provided by the NOAA PSL, Boulder, Colorado, USA, from their website at https://www.ncei.noaa.gov/products/optimum-interpolation-sst (last accessed 31/08/2022). The daily in situ SST time series for Leigh Marine Laboratory, Evans Bay, and Portobello Marine Laboratory are available from https://zenodo.org/record/6399921#.Y6EFN-xBzmF. The R package ‘heatwaveR’ is available on CRAN. The code and method related to this analysis is available at https://robwschlegel.github.io/heatwaveR/articles/MHW_metric_trends.html (last accessed 30/01/2023). A web-based application summarising the study results’ is available at https://frantoto.shinyapps.io/Coastal_Seasonal_MHWs_NZ (last accessed 30/01/2023) and the supporting code at https://github.com/FranToto/NZ-Seasonal-MHWs (last accessed 30/01/2023). The accompanying 200 NM analysis and results is available at https://doi.org/10.6084/m9.figshare.22872902.v1
(last accessed 17/05/2023).